For security professionals, the name of the game is understanding someone else’s code… and quickly.
Whether it’s on an internal team doing source audits, playing in a CTF, or hunting for bug bounties, we want to get to the key parts of the code and start finding bugs as quickly as possible.
Spending time reading code in many security scenarios is actually an anti-goal, we’d rather understand the codebase and while reading as little as possible.
So today we’re going to focus on an area near and dear to my heart: using visuals to help us understand code and get to finding bugs faster.
How to use visualizations effectively#
Let me start by making one thing clear: visualizations aren’t necessarily a good thing in and of themselves.
Some visualizations are just eye candy, and while beauty may be a form of utility, for security work we want things that can help us get the job done faster.
Luckily I have devised a simple technique that can help us get the most out of visualizations: ask yourself “what question am I looking to answer?” and then see if what you’re looking at helps you answer that question, or make one that does.
By focusing on the question we’re trying to answer, we’ll avoid spending time wandering around overly-large diagrams and admiring beautiful or well-organized trivia.
So let’s start with a common first question: “where do I start?”
Understanding a new codebase faster#
The standard advice on how to approach a new codebase is to start by reading the docs or using the target software to get a general idea of how it works.
This is fantastic advice, because both activities help quickly form a mental model of the target system: what it’s supposed to do and how users interact with it.
A rough model of the system (inputs, outputs, dependencies, etc) will help us come up with ideas for possible security issues as well as help give mental anchors for when we start looking at the code later.
The next step for large targets is to orient ourselves to the codebase, so the question to start with is something like “how is this codebase organized?” or “where is the stuff I care about?”… and this is when using something a little stronger than ls can save us time.
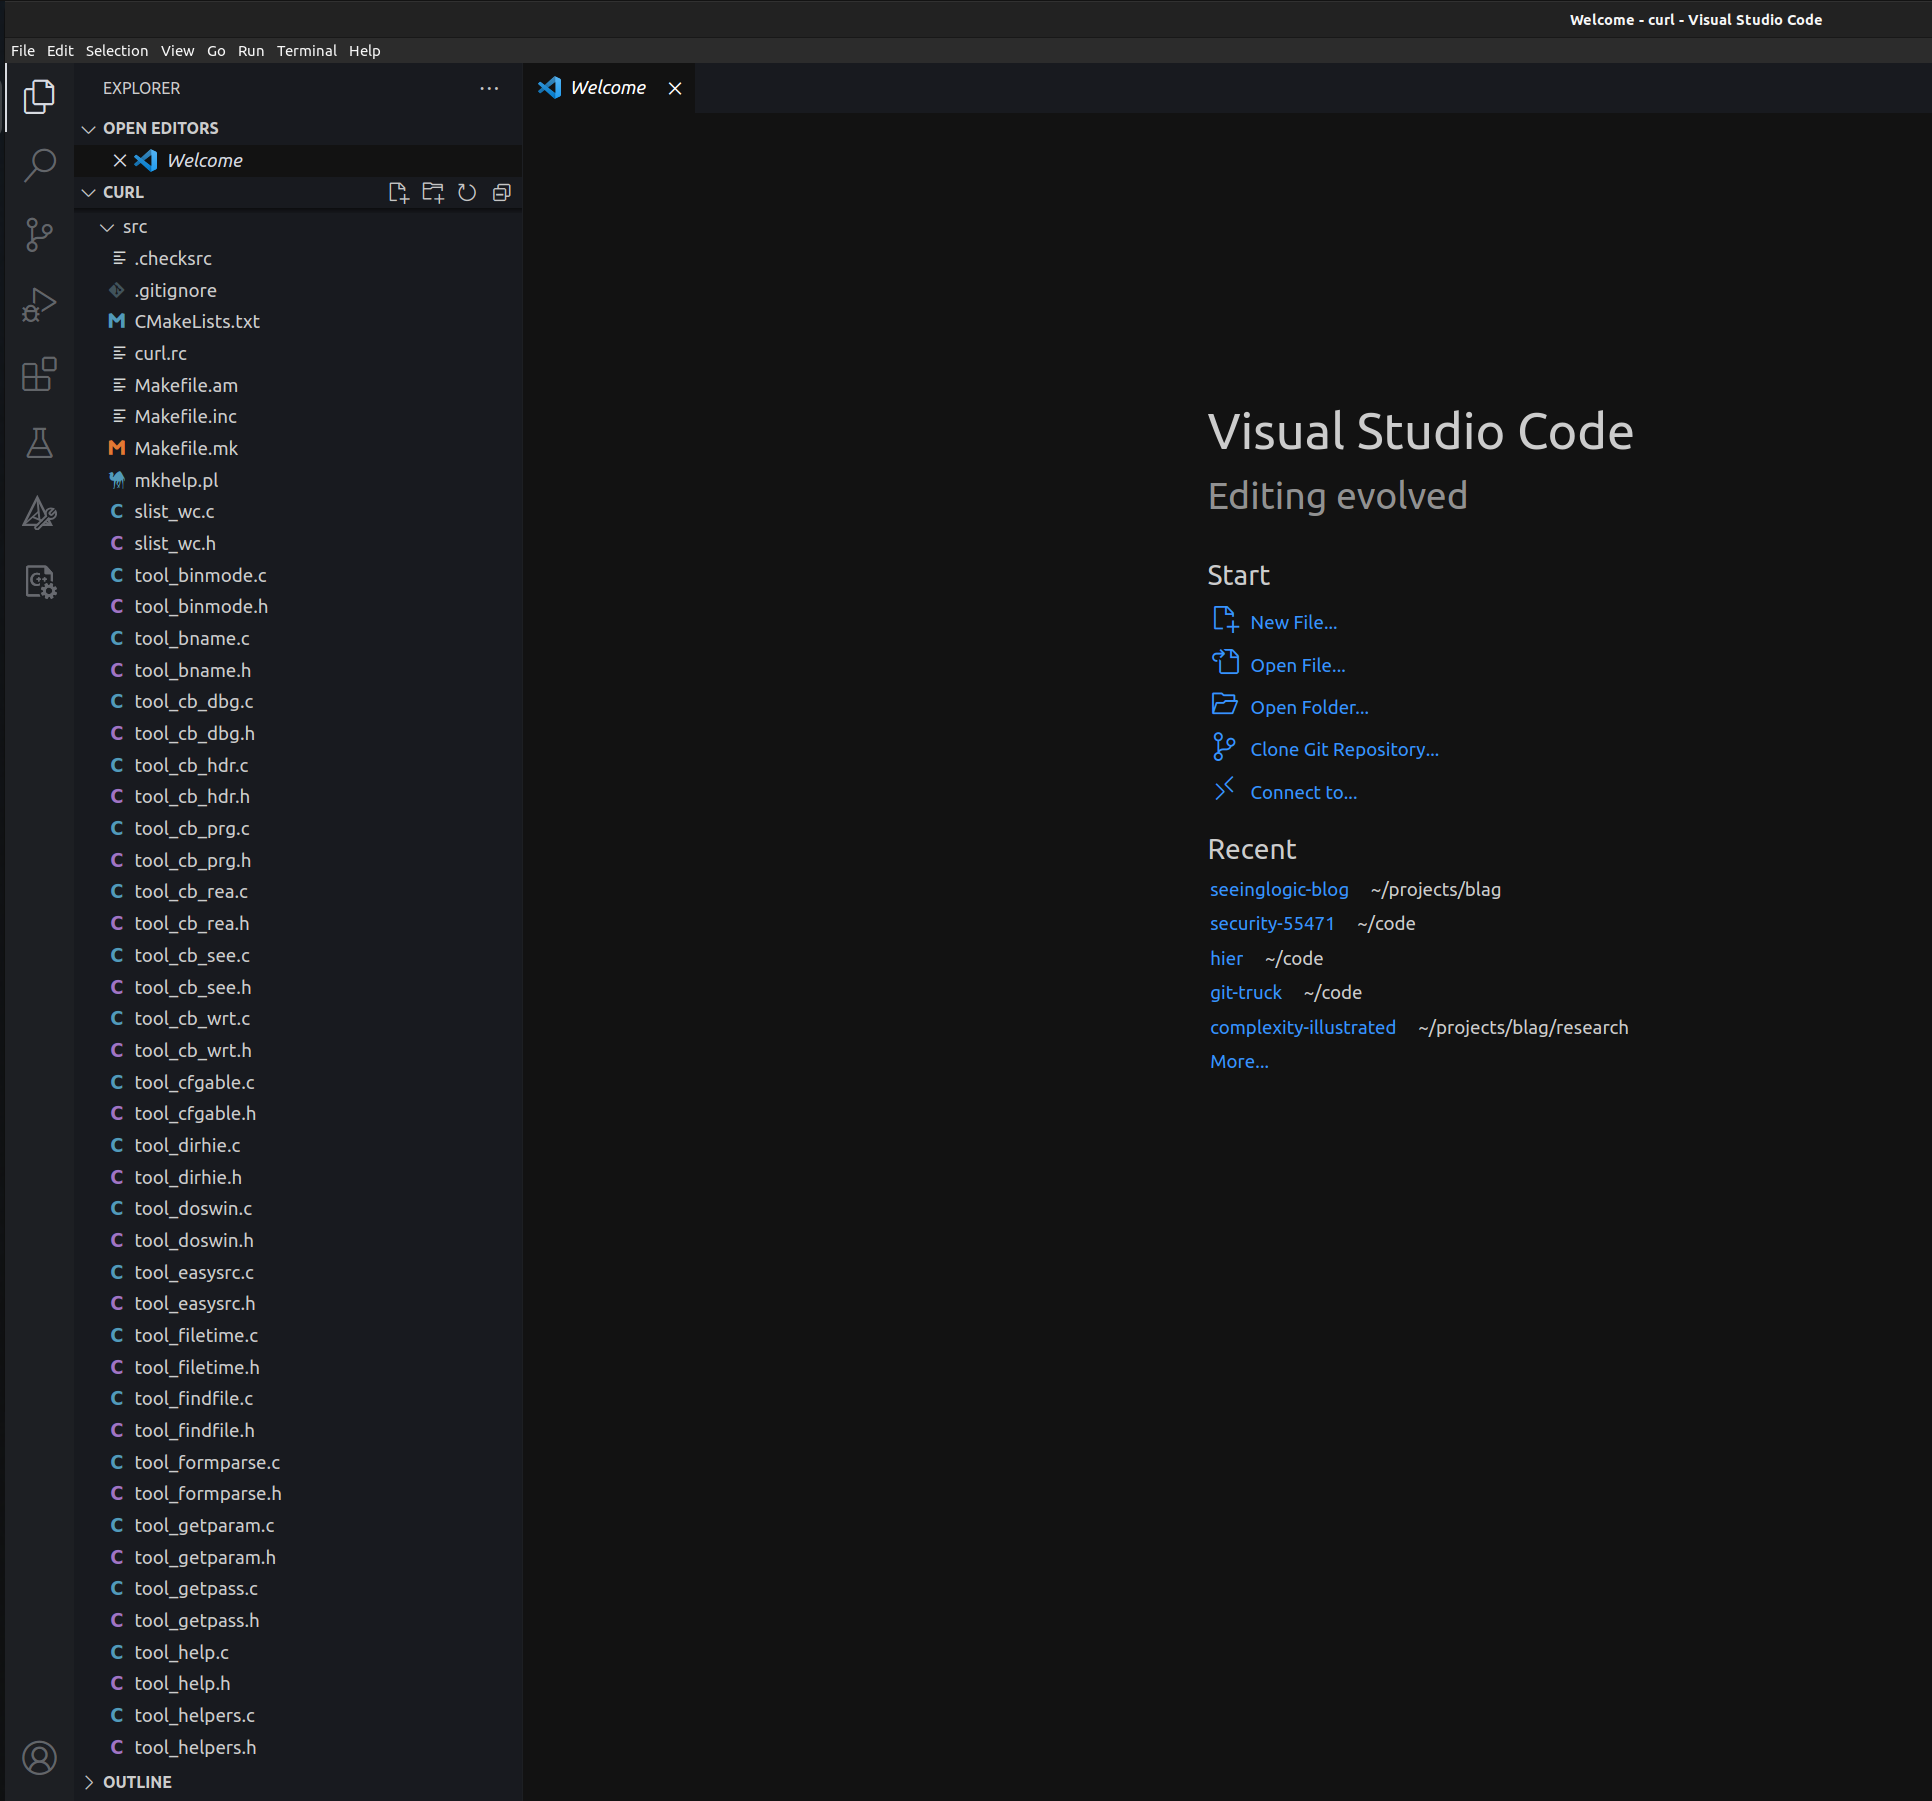
For these questions, we want a picture or visualization that gives us an overview, but there are a couple variations that can help with large repositories depending on the specific question we’re trying to answer:
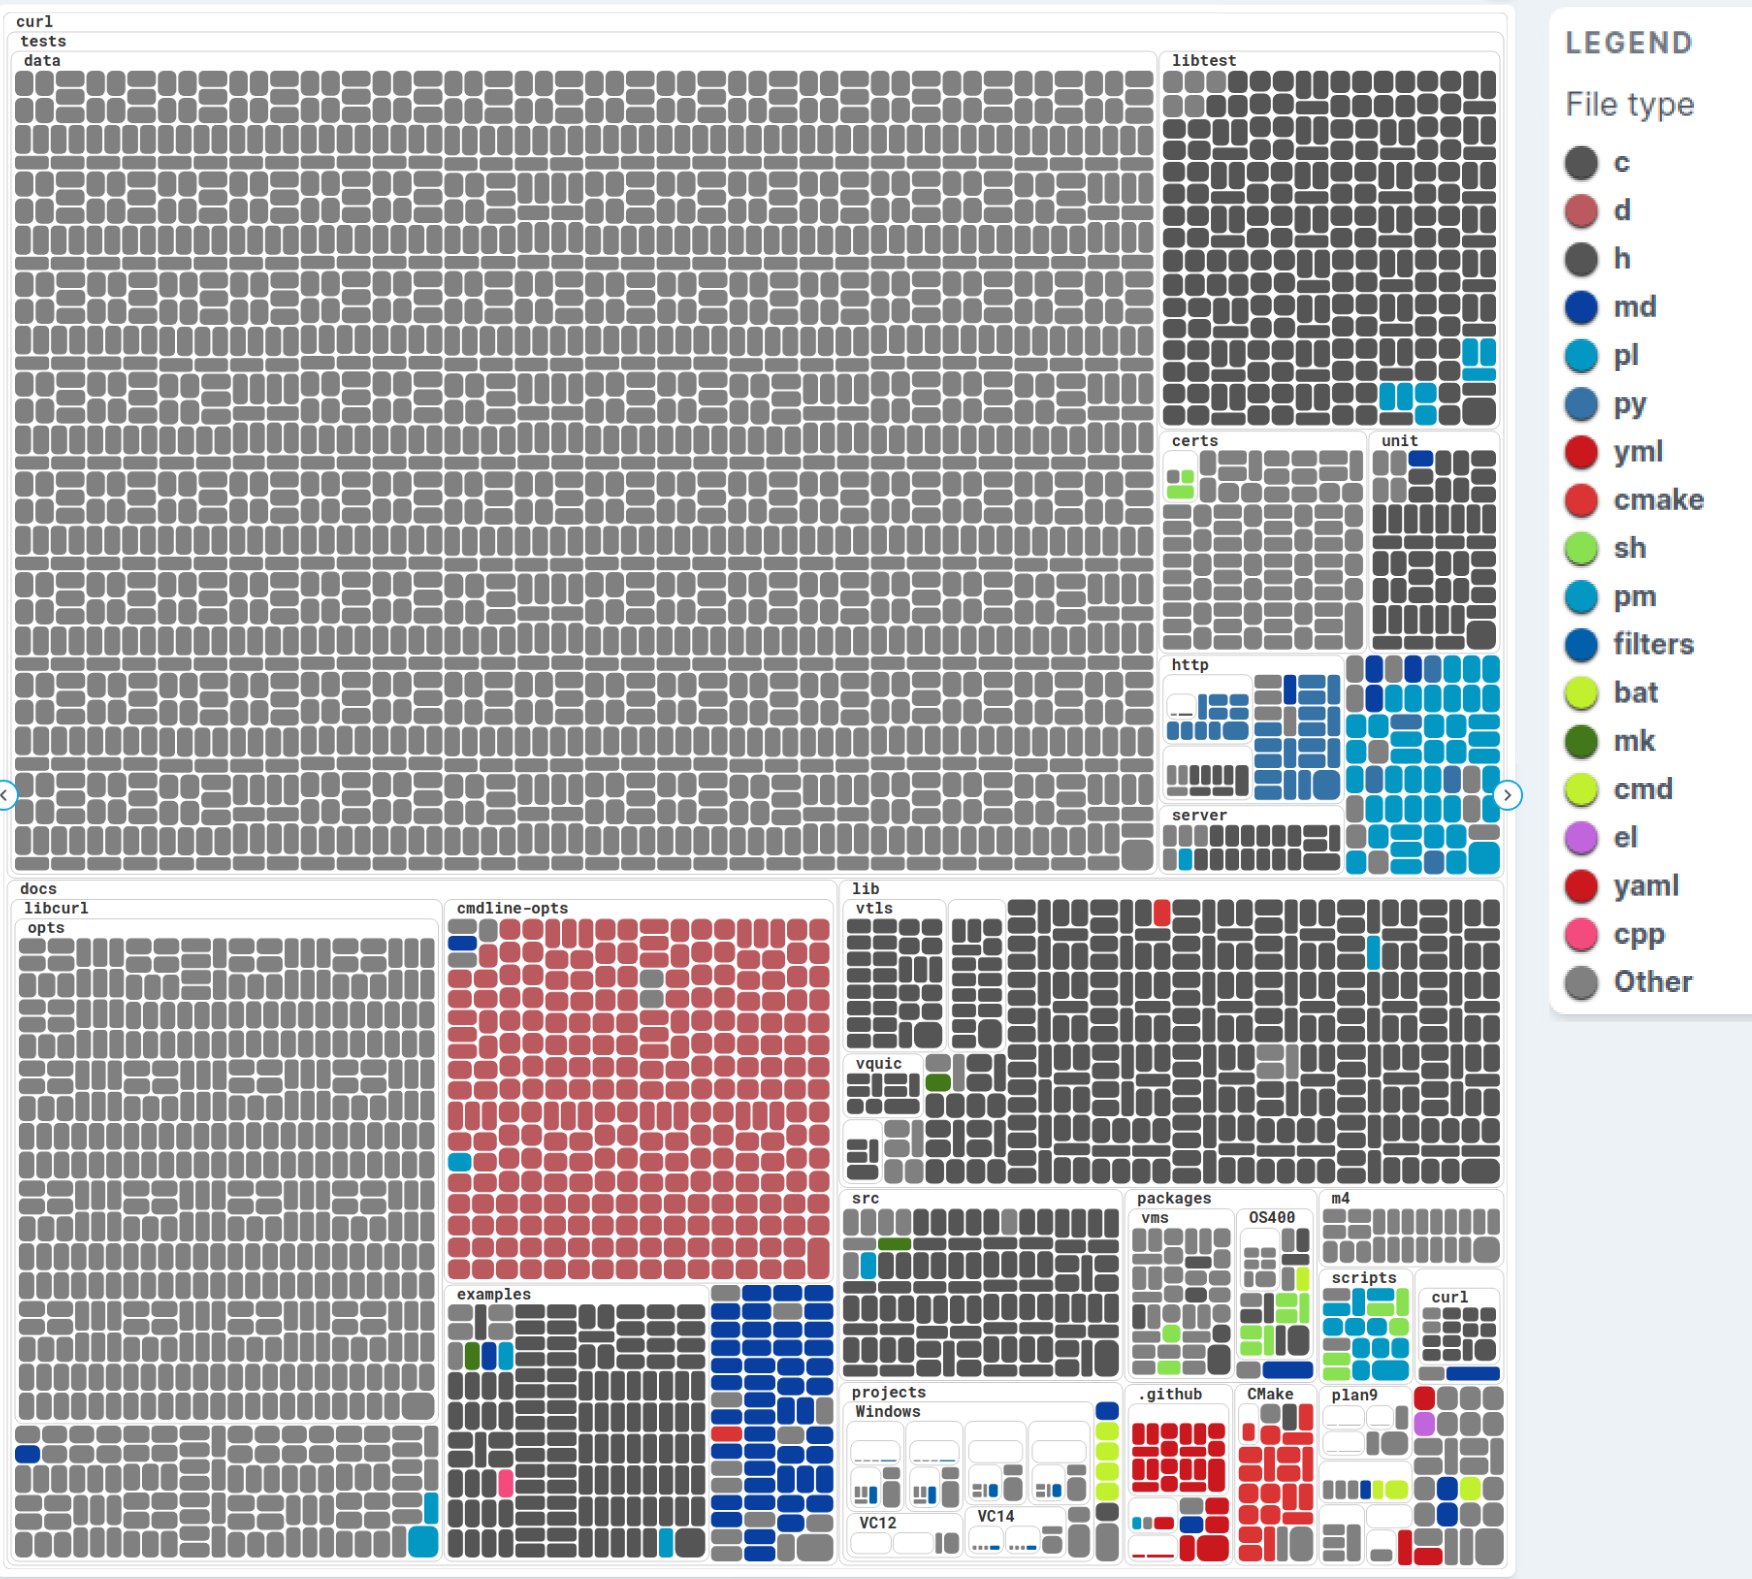
- “What kind of files are there in the repo and where?” Try a Treemap without node sizing and colors based on file types (I like git-truck, which uses D3 under the hood):
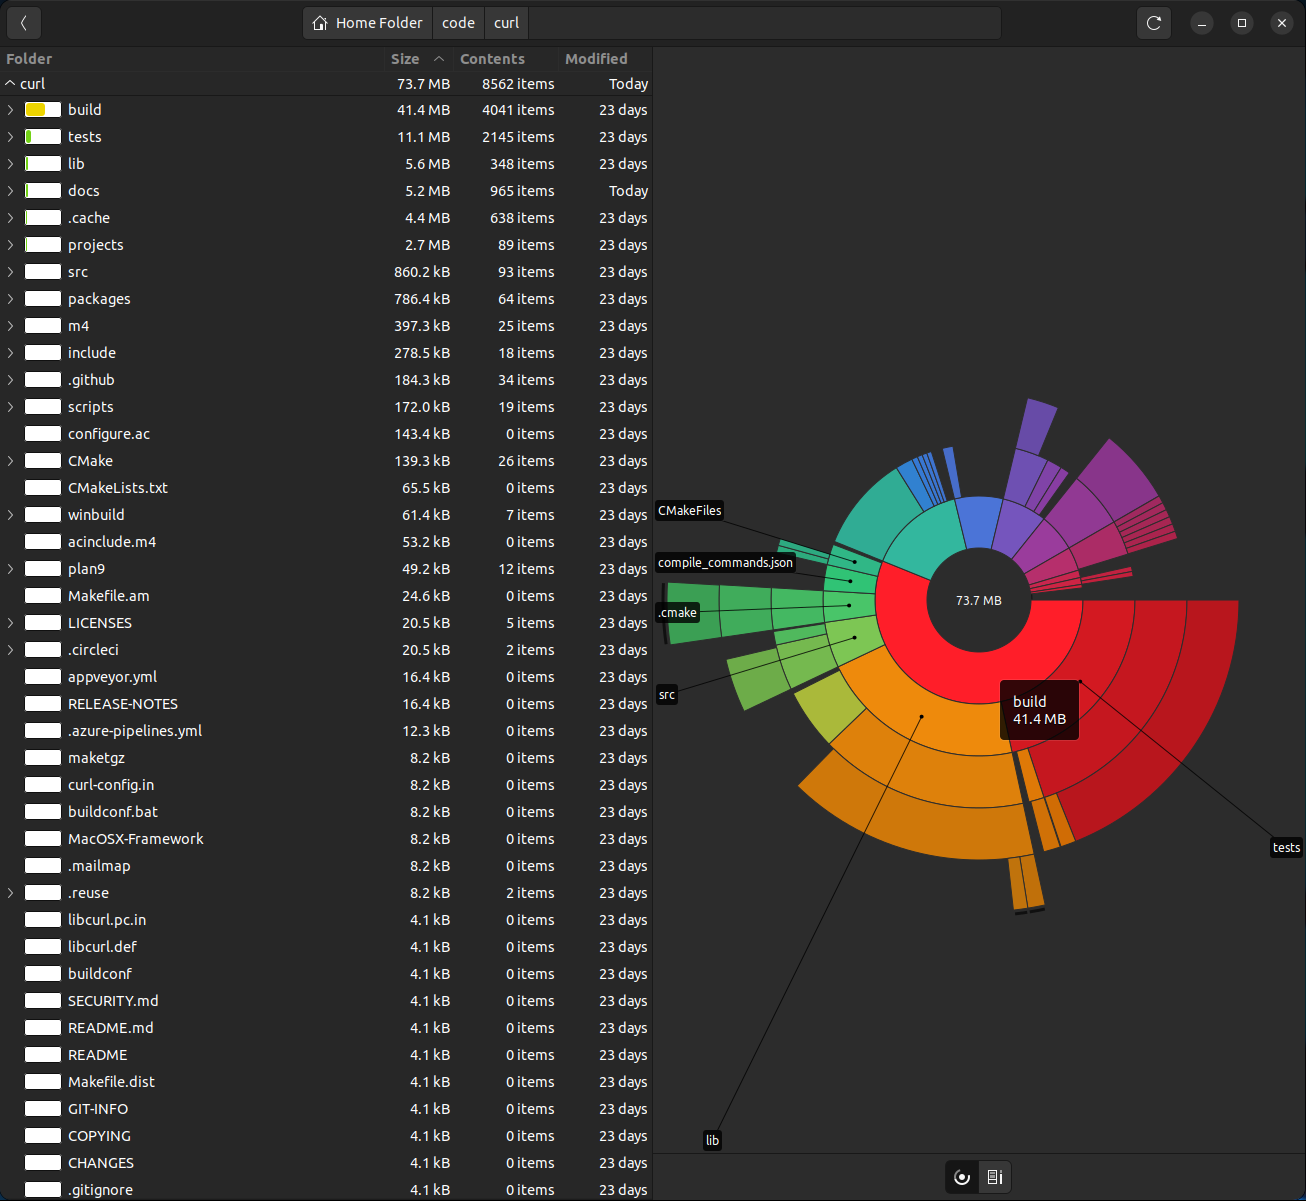
- “What’s the general directory/file layout and where are the big files?” I like interactive Icicle or Sunburst views where you can click to zoom in, preferably with an explorer tab like in baobab aka “Disk Usage Analyzer” (for my command line junkies, the simpler ncurses experience of diskonaut might interest you).
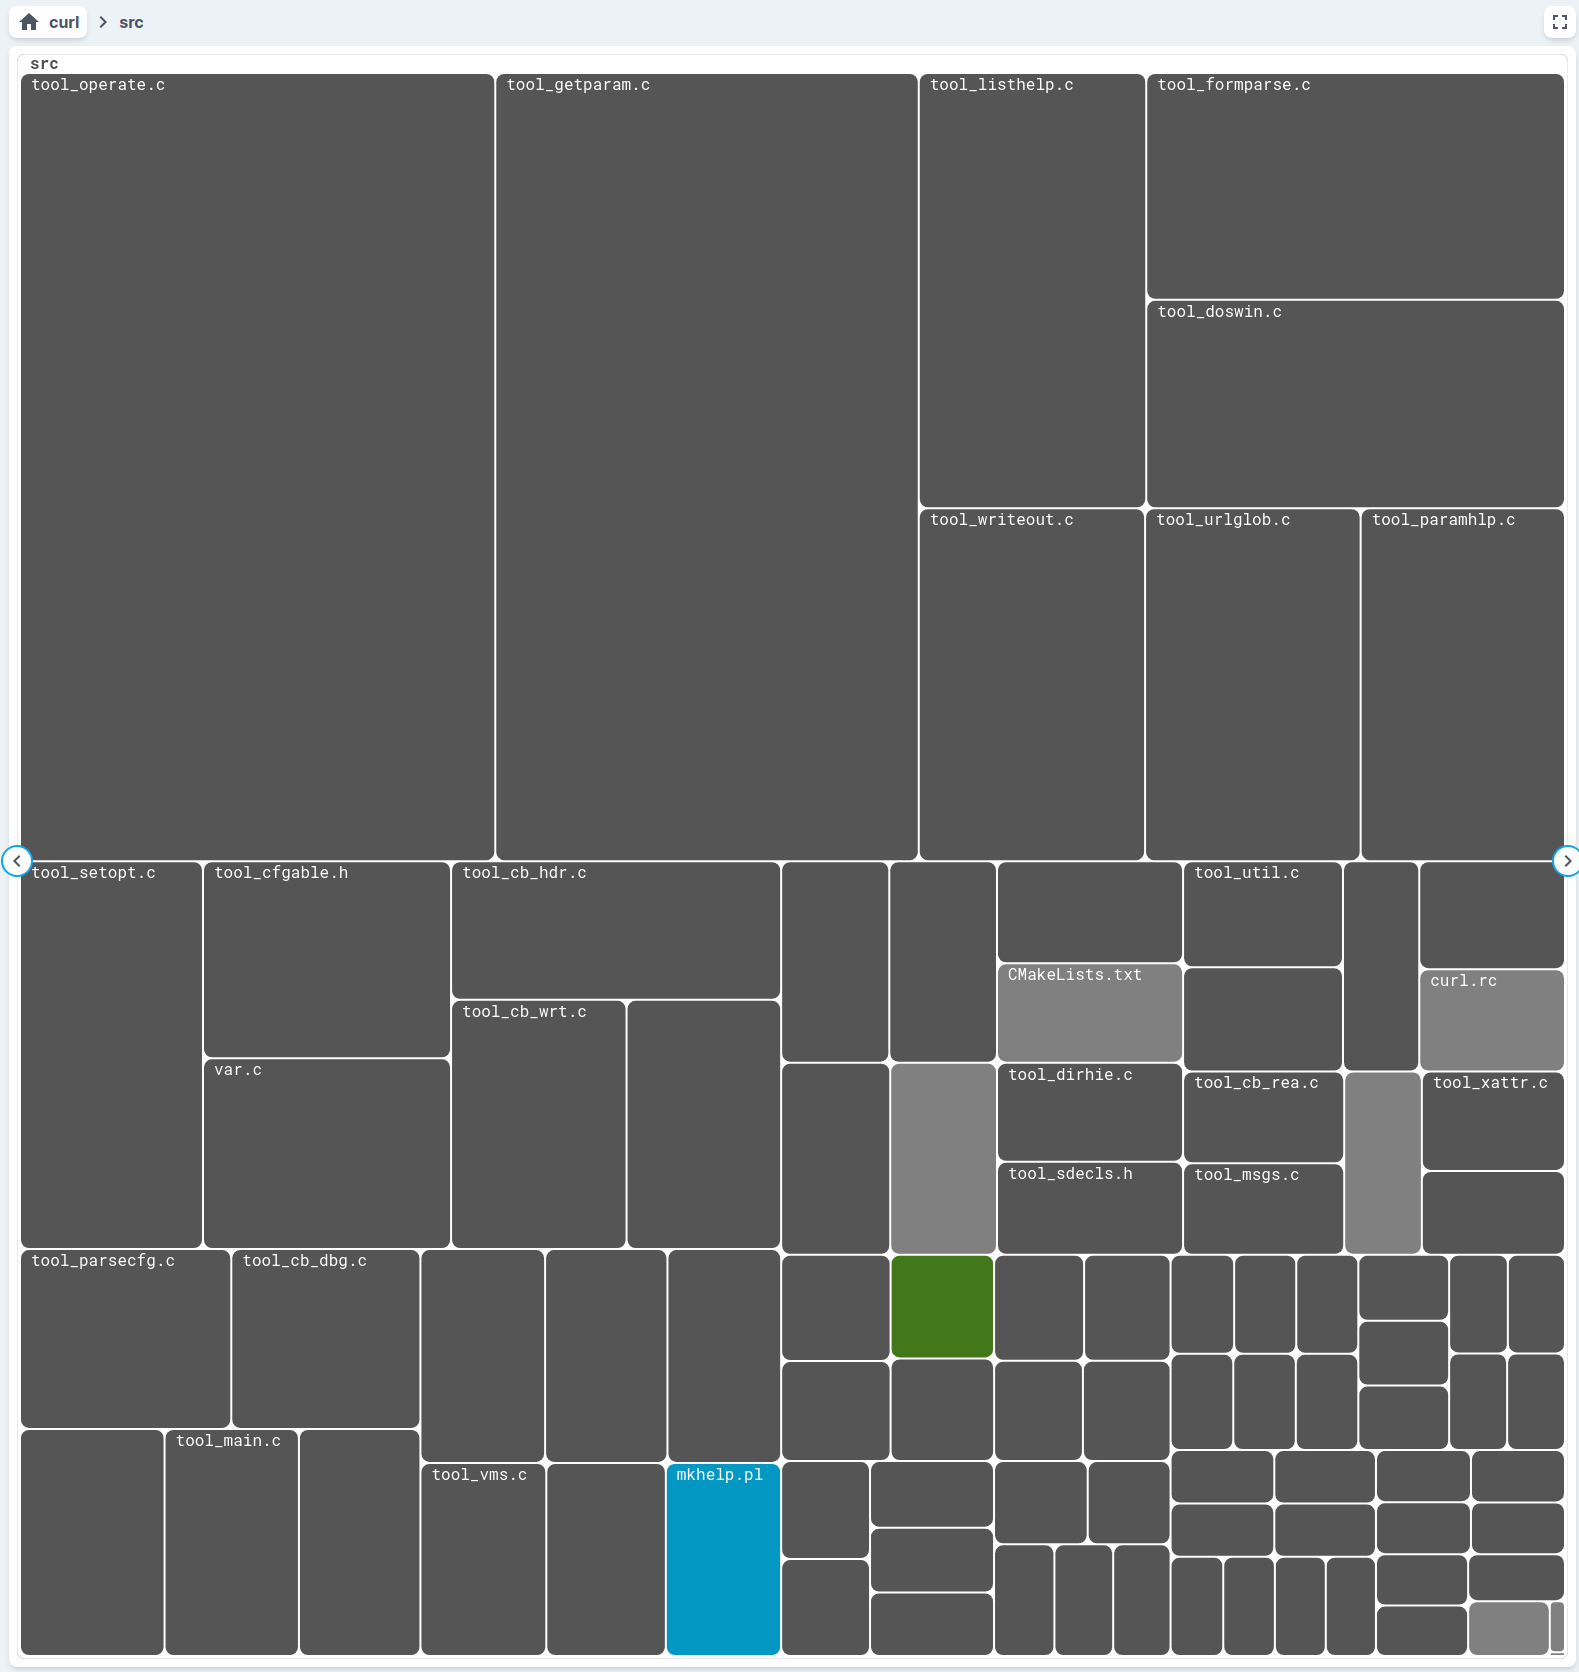
- “Where are the largest source files at?” Treemap again, this time with node sizes based on file size, and focused in the primary source directory.
These aren’t particularly security-oriented questions, but orienting quickly to a big codebase cuts time out of the initial familiarization step which is often just written off as a sunk cost.
Finding footholds in unfamiliar code#
The next set of questions are based around finding a spot in code that deals with functionality that is likely to have security implications.
In practice, this can be as simple as grepping for function names or code snippets, but let’s explore how visuals can help us find and assess a foothold.
High-level diagrams like component or file relationships might help, but just dumping everything in the project into a visualization usually results in a picture that shows way too much to be useful.
Take the question “Does the target start new processes?” as an example.
We could look at file relationships to see module imports and look for subprocess to see if the code starts new processes… but there’s a lot going on even in a small project like the one depicted below (narrowed down to 4 source files).
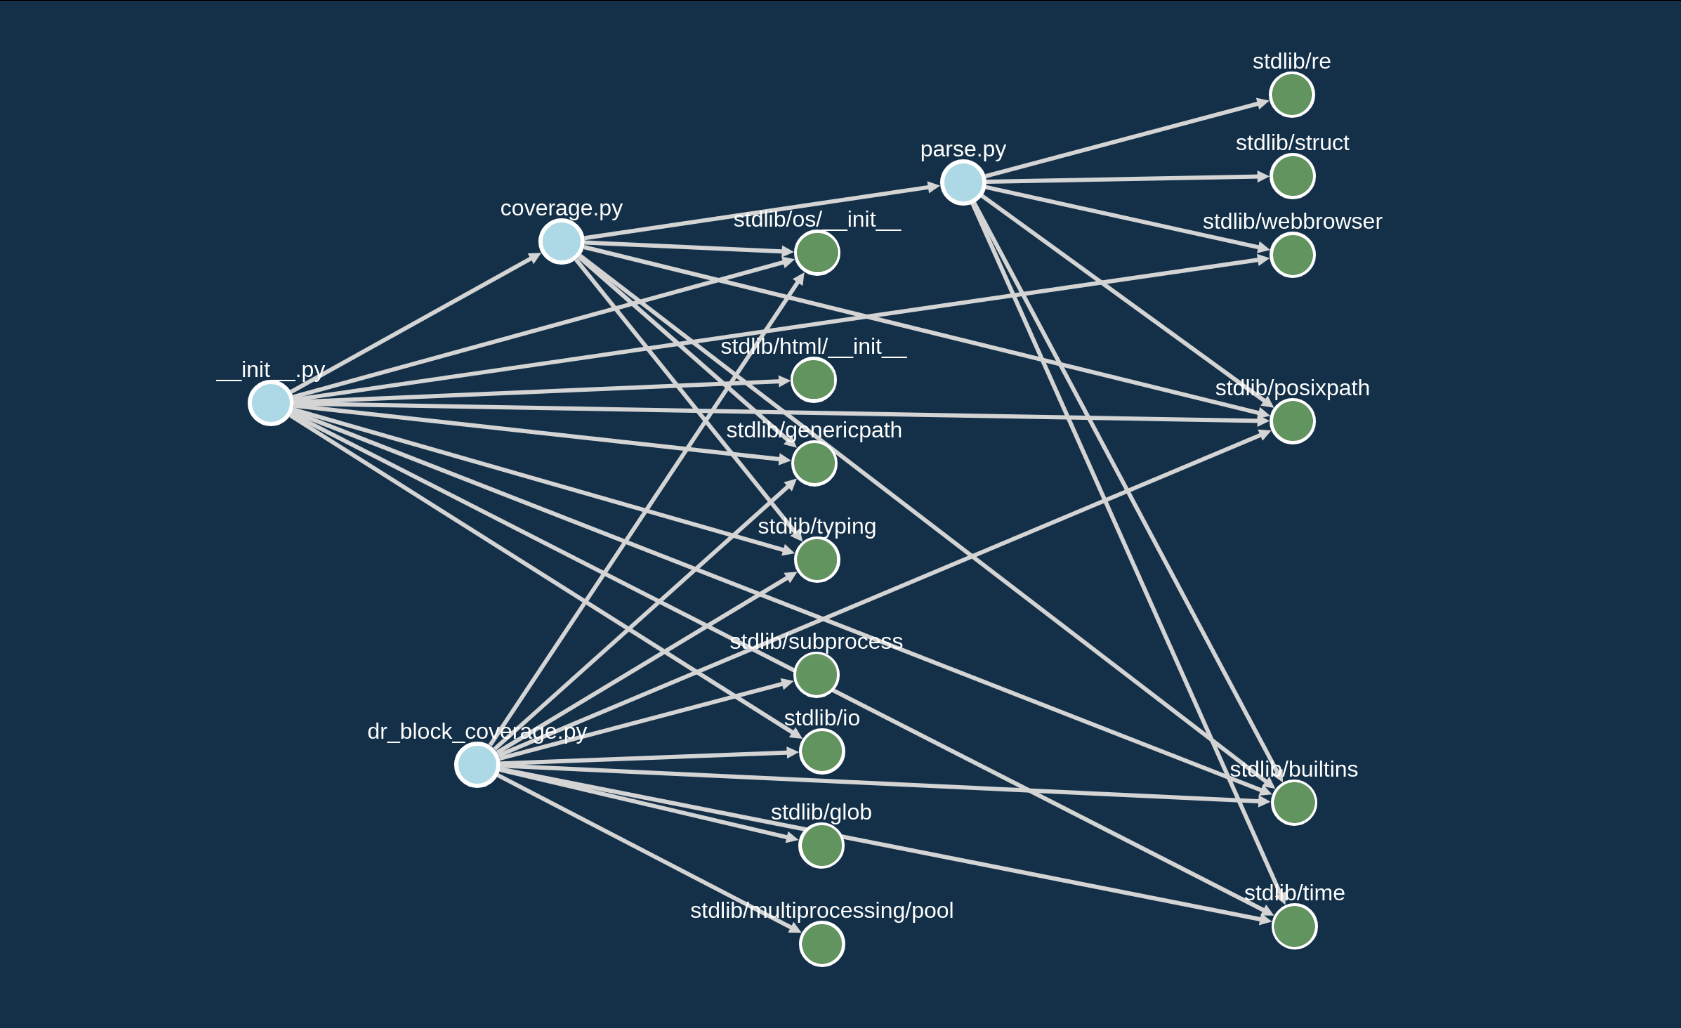
Instead we’d like visualizations that quickly give answers to more specific questions based on our understanding of the target, using a visualization to see where that functionality is if it is present and give an idea on how it connects in the code.
So yes we could look at the big file graph above, but it would be more efficient to grep for things like subprocess to find the files and then look at the call graphs for function calls of interest, which in this case would yield a 1-hop call graph for the Popen constructor that looks something like this:
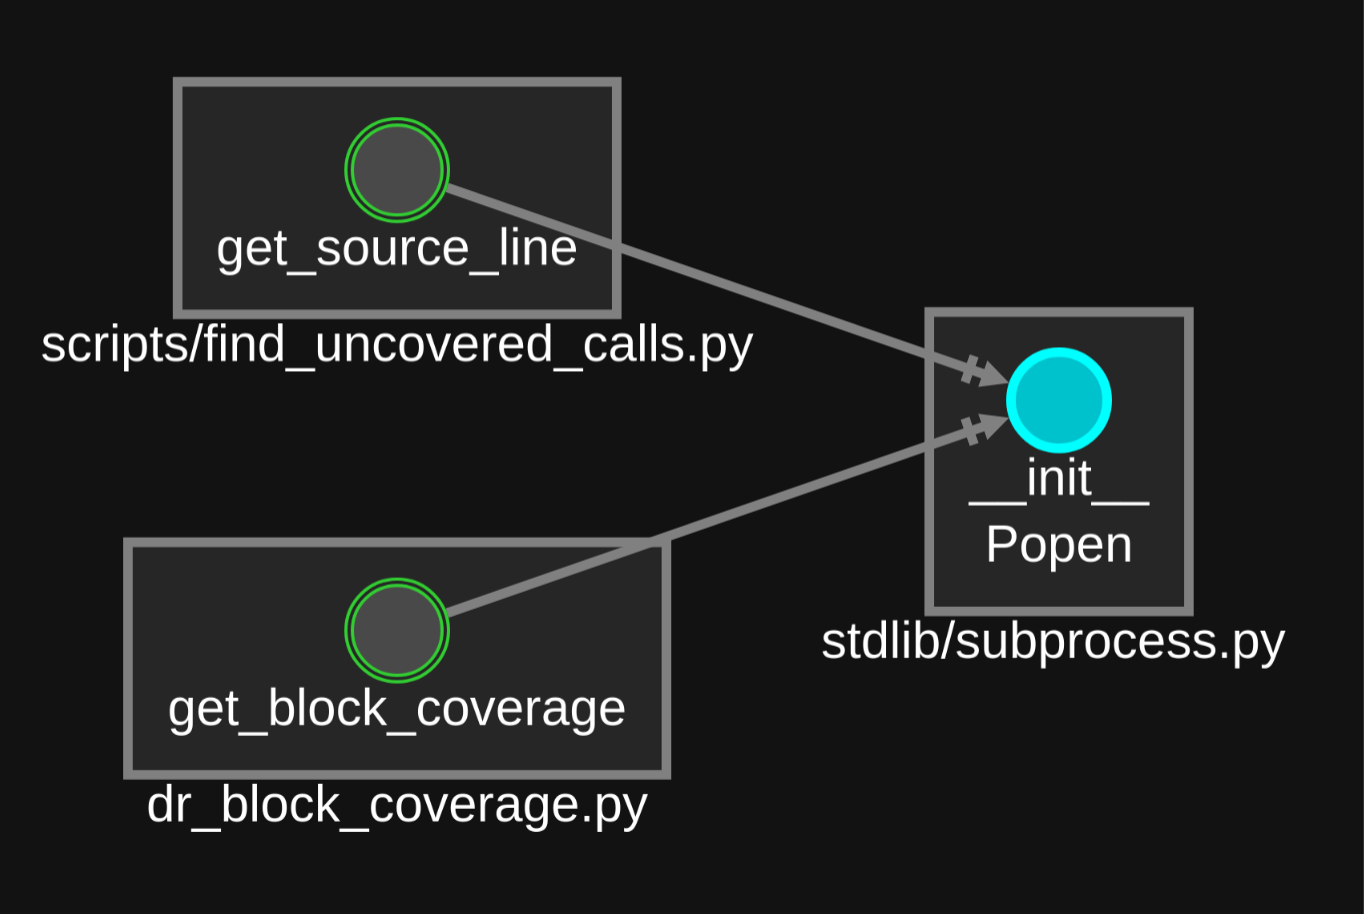
Now that we’ve found files and functions using the subprocess functionality, we can begin investigating this to see if we can move quickly to finding a bug.
But investigating requires a new set of questions.
Investigating a potential security finding#
Once we find a part of code that might be security-relevant, we need to understand the context to determine the potential for vulnerabilities.
There are two general types of approaches, static: looking at the code or disassembly, and dynamic: collecting data from running the target; each has benefits and drawbacks.
We’ll start with static, well, because reading the code is the simplest thing to do.
The two most common visualizations for static analysis are control-flow graphs (CFGs) and call graphs, which provide intra- and inter-procedural context, respectively.
Understanding a bug usually means asking questions like “Where does this buffer get used within this function?”, which usually requires some combination of control flow or data flow analysis, and for this case CFGs are the best way to see conditionals and paths between different parts of the function.
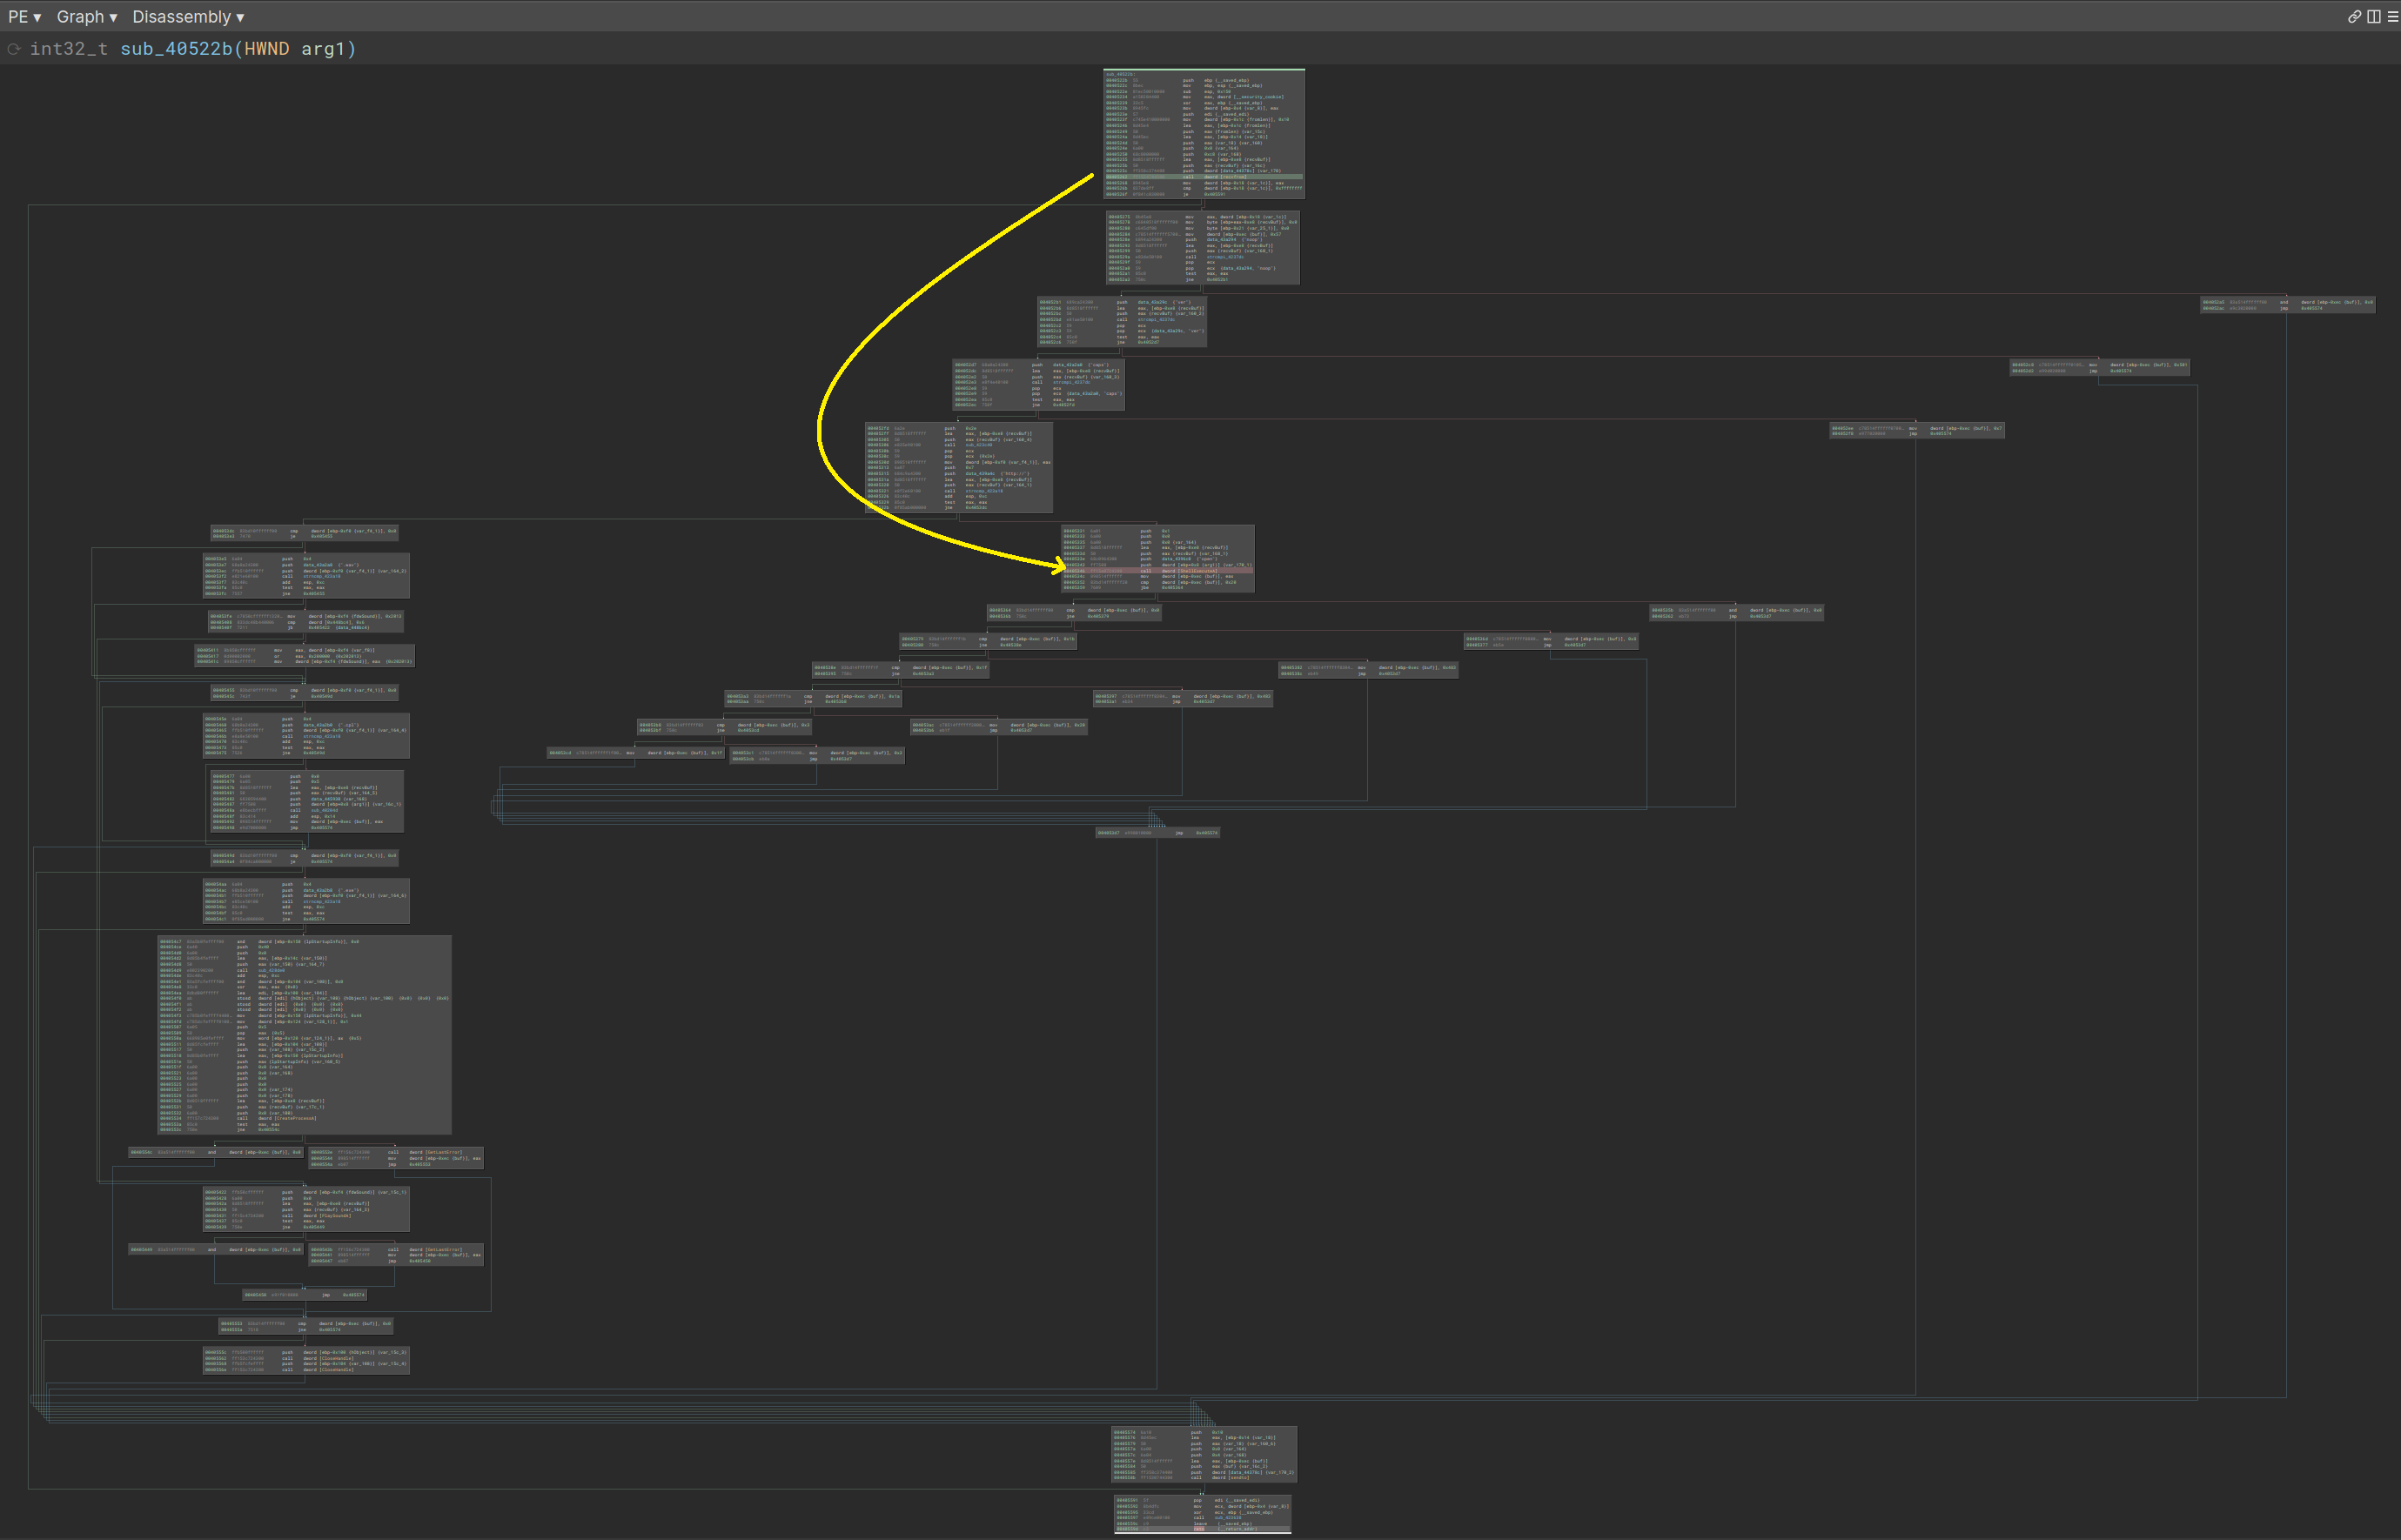
Naturally this is the common view that reverse-engineering tools give… except Ghidra, which focuses on decompilation/disassembly, and makes some “interesting” decisions when it comes to graphs and edge handling.
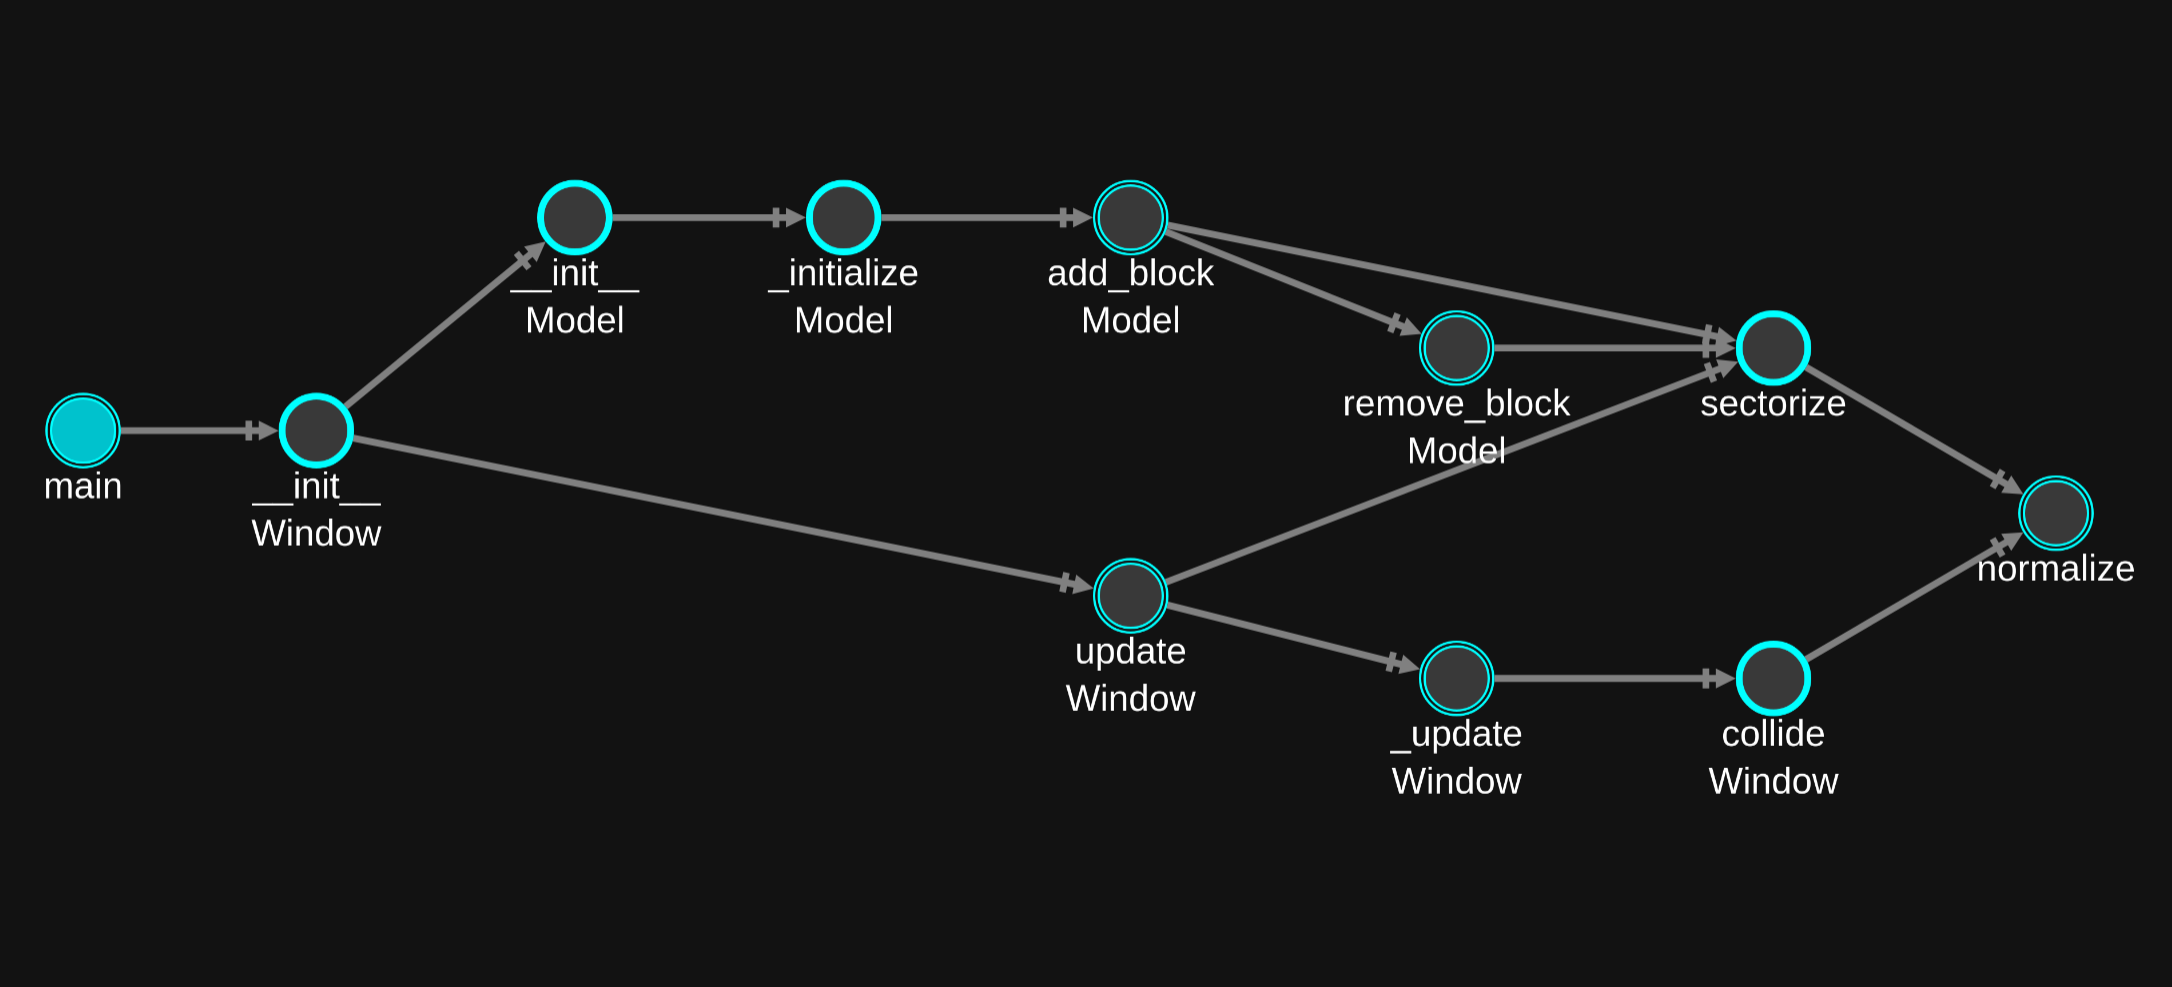
By contrast, call graphs are the best tool for understanding context across functions, where the questions are usually “can I get from here to there?” or “how does data flow from this input function to this interesting processing function?”.
I think call graphs are often underrated because a lot of the related tooling isn’t great, but solid call graph navigation can help us orient to the code quickly, see related functionality, and answer reachability questions (full transparency: I’m building tooling to give better pictures like the one below).
Static analysis is nice because reading code is as straightforward as it gets, but dynamic analysis helps us focus on what happened in a particular execution, and naturally the visuals are typically related to things like coverage information (what code executed) or location/variable accesses over time.
Having dynamic analysis visualizations integrated with your static tools is many times more efficient than having to piece together stuff; for example using an integrated debugger in Binary Ninja or Ghidra keeps us from having to flip back and forth between gdb and mentally map where you are onto your nice decompilation or disassembly CFG.
This is also the purpose of coverage analysis tools like bncov, ariadne, and lighthouse, because they all allow us to see what code was exercised and get an idea of which executions reached an interesting code location (or which got the closest) by integrating this information into the tool you’d already want to use.
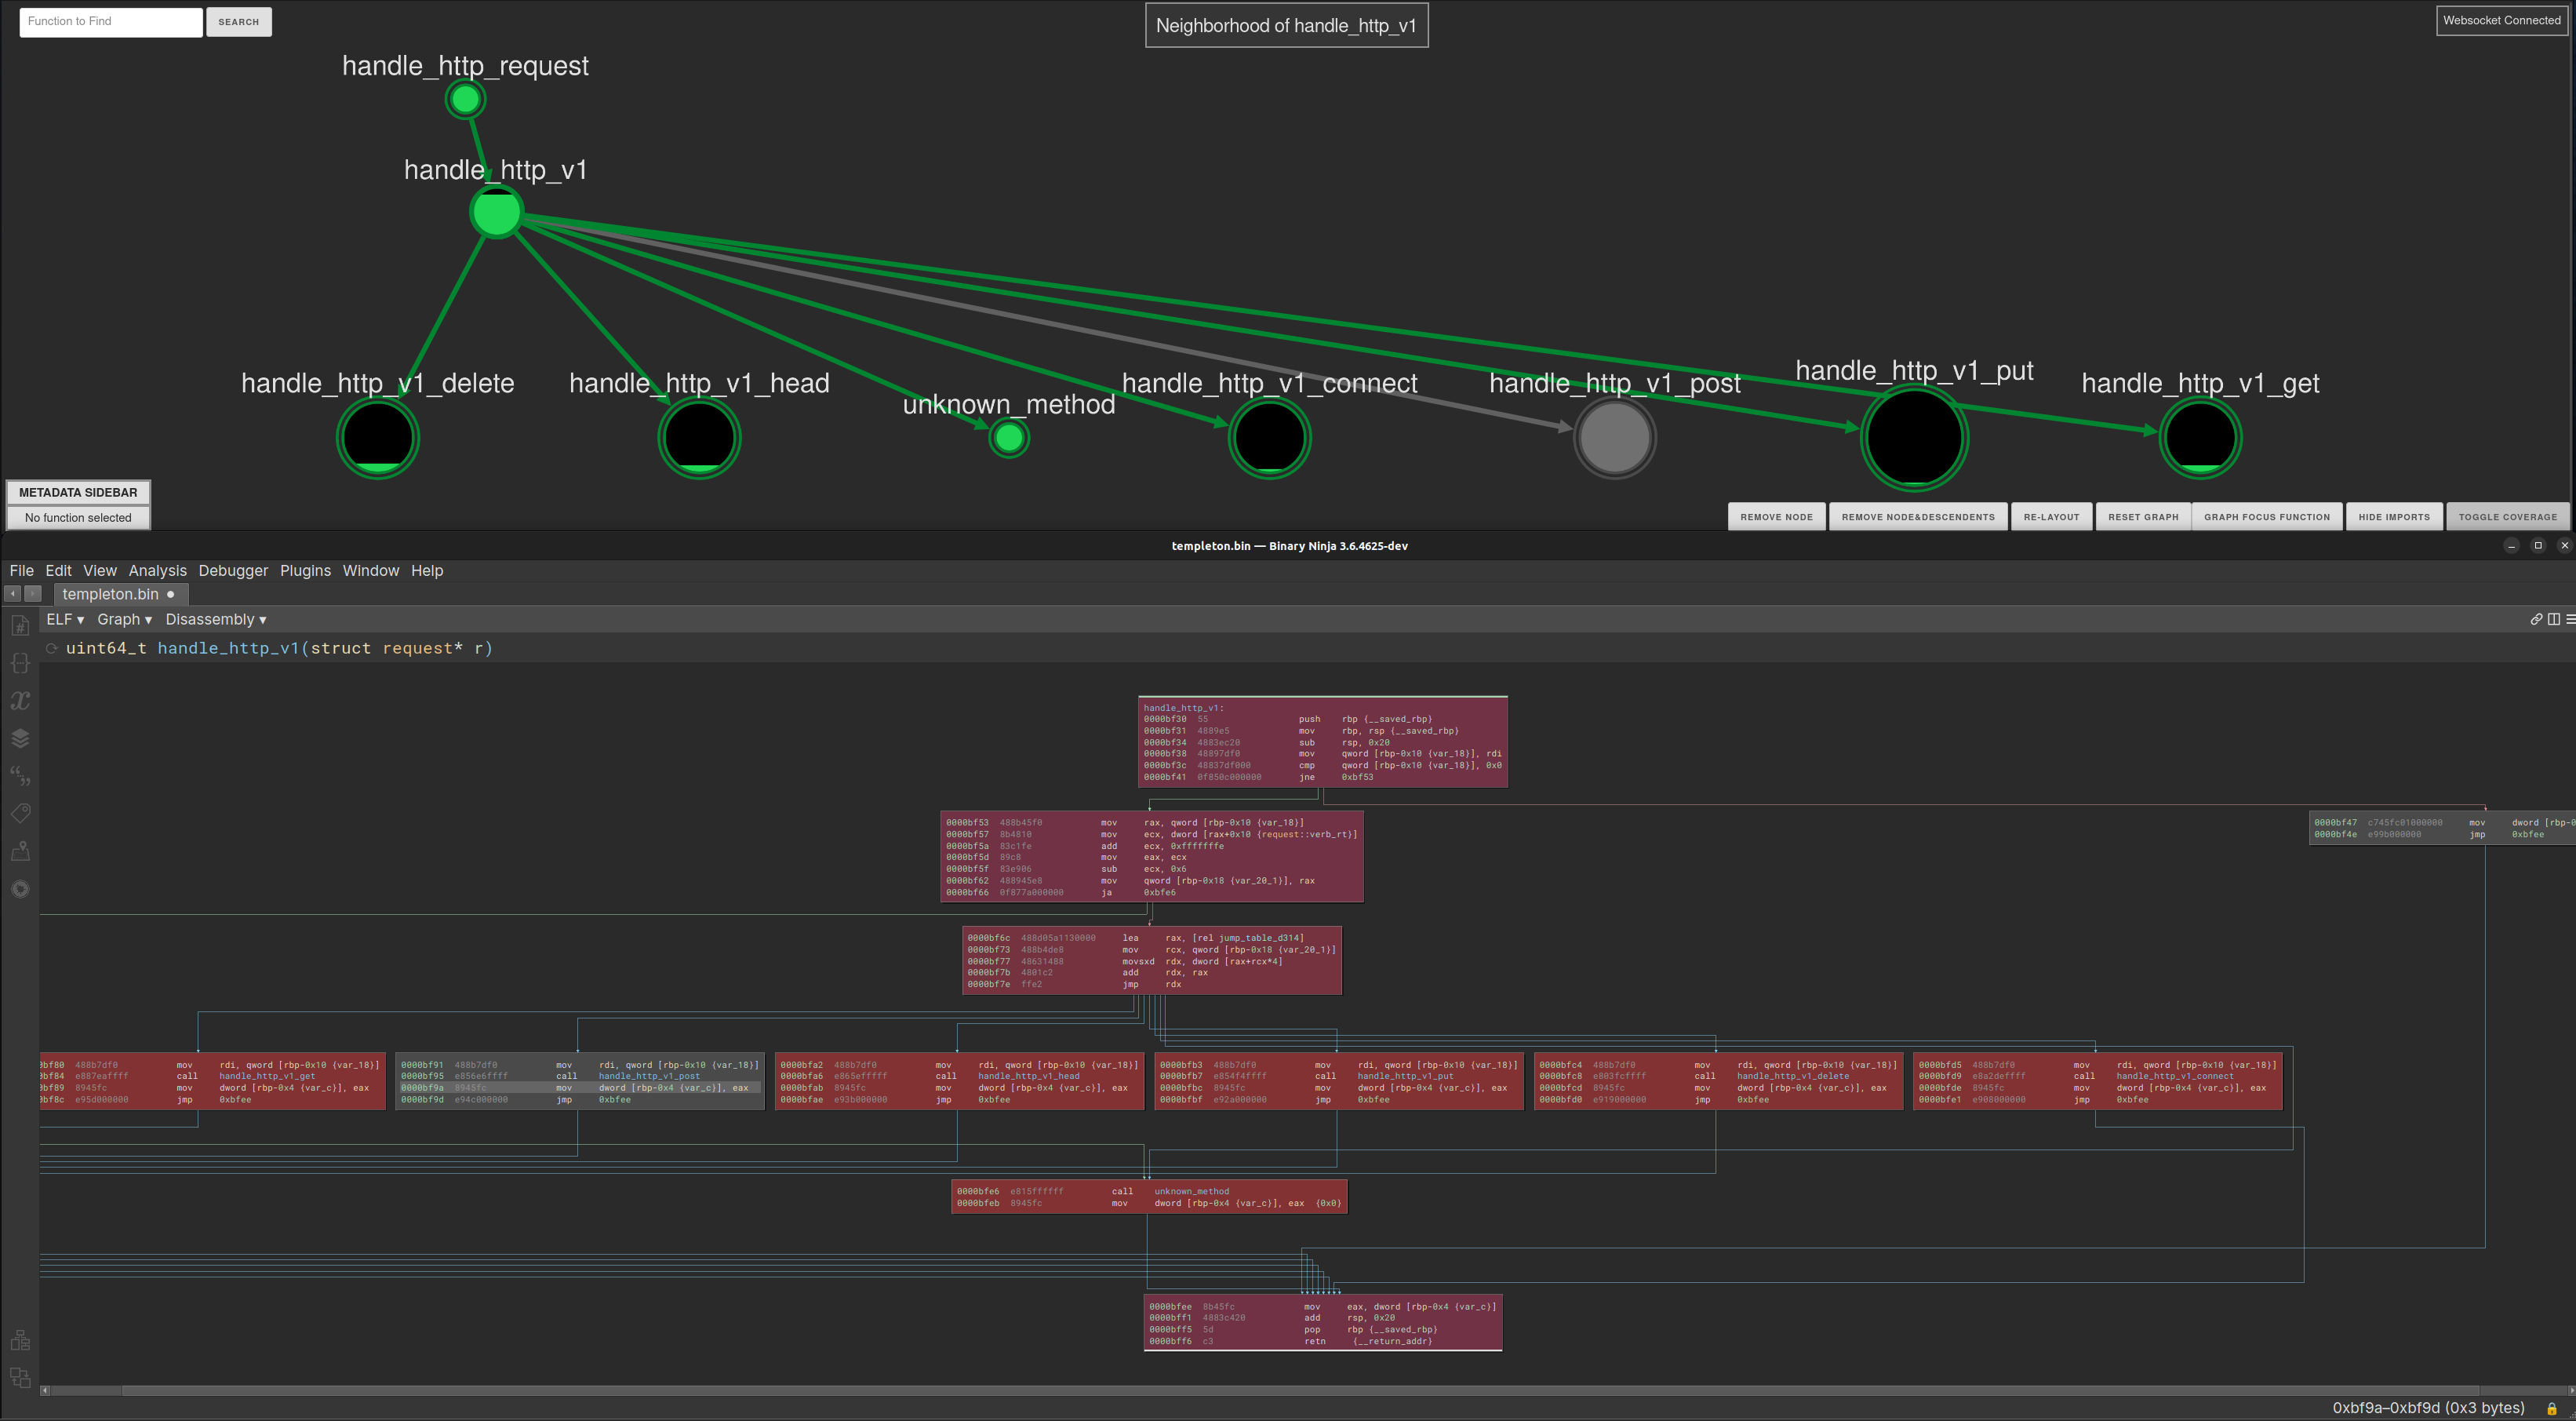
Though some of my friends prefer to roll with the “big screen and a good tiling window manager” approach, so do whatever works for you.
Using visual tools like these help us understand how to reach the specific code you’re interested in and navigate all the relevant code from input to vulnerability, which is the key to understanding whether a bug is reachable and exploitable.
From here we can use similar techniques to explore variations or find others way to reach the code in question, or to find ways to leverage a bug primitive into a more critical finding, like turning a file write into code execution.
It’s just a matter of creativity and seeing what we need to in order to understand the possibilities!
Getting to the end in less time#
We’ve covered a few ways visuals can help us answer questions and build understanding quickly, which is critical in security work.
Not surprisingly, this is something I’m actively investigating and building tooling to enable.
If you’re interested in this sort of thing and you’re a Binary Ninja user, check out Ariadne and open a GitHub issue for bugs or feature requests, or DM me directly to let me know what you think.
If you’re looking at source code instead and want to apply these same kinds of strategies, drop me a line because I’m looking for people to help try out different strategies and visualizations to find what’s most effective.
Next time we’ll break down some speed techniques and patterns of top-tier hackers… until then, good (bug)hunting!

