Whether you’re in a CTF or troubleshooting a bug for code you (or a coworker) wrote, understanding a bug quickly can make the difference… because let’s be real, nobody likes digging around in a debugger like we’re feeling around for sharp objects in a dark room.
Today I’ll share a workflow using gdb, Address Sanitizer (ASAN), and graphs to quickly grok a bug in a codebase I’d never seen before.
These tools give us precise information we can use to make a consistent graphical view, which reduces confusion and helps us understand things faster.
Time to ditch the chopsticks; let’s get some practice and level up our debugging!
Understanding the initial crash#
I’m going to use a sample program from a research dataset: union from the CHESS ACES repo, which is a C target that includes a script that crashes it, and a patch that fixes the bug.
So while this is an artificial example, all of the techniques apply here to larger and more complicated software.
Let’s practice building a bulletproof understanding of the bug using some powerful open source tools.
First let’s reproduce the crash in a debugger:
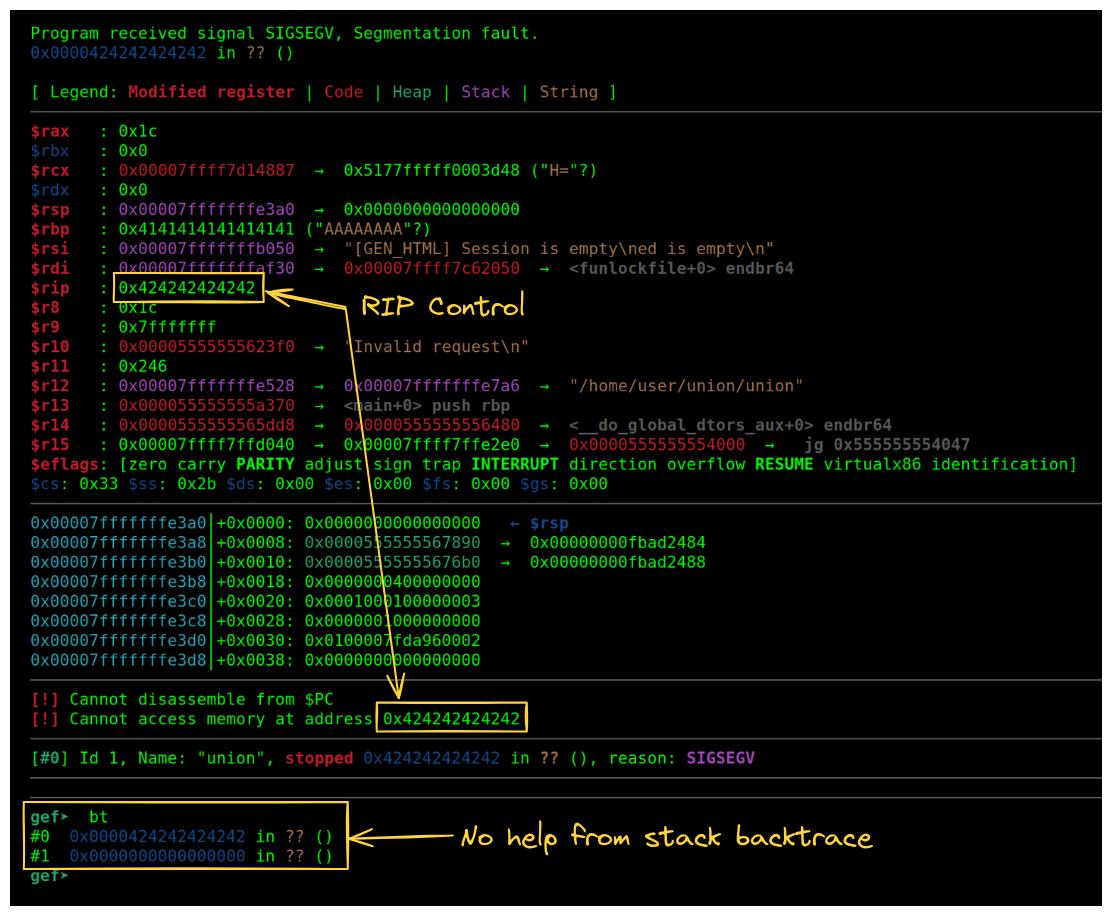
First thing to note is that I’m using gef as my .gdbinit file, which shows a lot of useful context information every time the debugger stops.
Looking at this information, we can see this crash is a clean stack buffer overflow demonstrating control over the instruction pointer.
The good news is that this kind of vulnerability is well-known, and these kinds of bugs usually aren’t too complicated to understand.
The bad news is that since our stack is smashed and RIP has already run off the rails, the backtrace isn’t immediately helpful. Luckily, there’s something that can give even better information on the crash!
Precision understanding with ASAN#
Our next step is to locate where the initial buffer is allocated and where the overwrite occurs, which may not be in the same function.
Address Sanitizer (ASAN) is purpose-built to help with this; it can detect out-of-bounds accesses for heap, stack, and global variables.
To get ASAN we have to compile with the flag -fsanitize=address, but since we’ve got the source to this challenge, that’s no problem.
$ CFLAGS="-g -fsanitize=address" LDFLAGS="-g -fsanitize=address" make
# ...build output omitted

$ grep ASAN ./build/union
grep: ./build/union: binary file matches
Then running our newly built target with the crashing input should yield some output from ASAN…
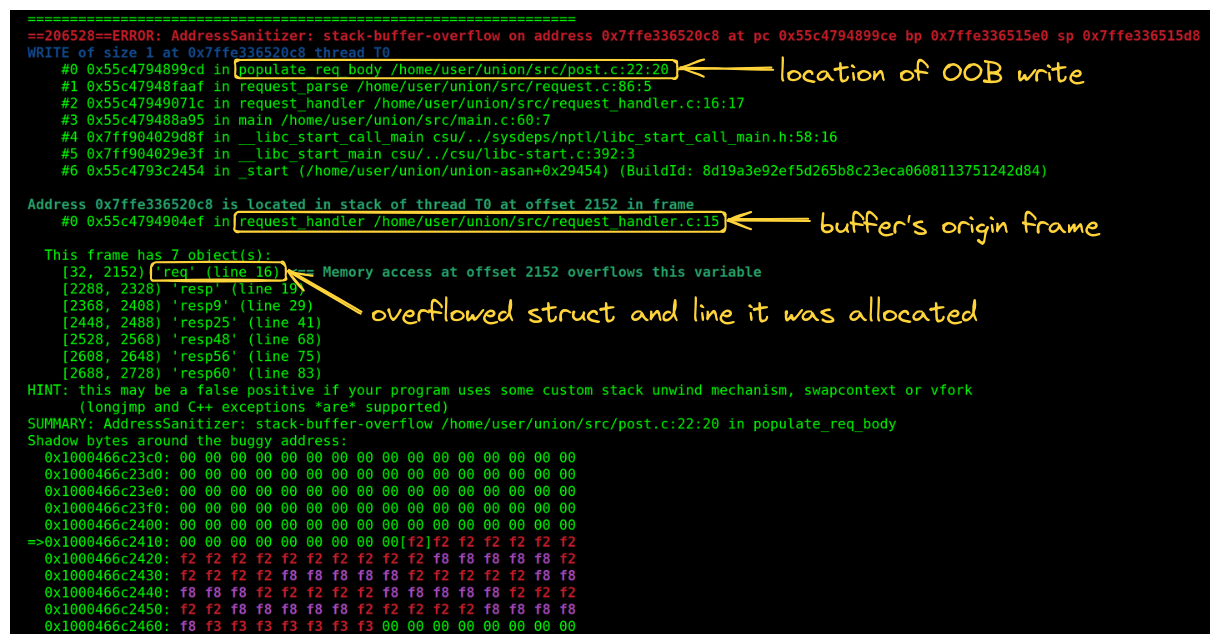
Perfect! We actually get a backtrace of where the out-of-bounds write happens, plus information on the frame where the stack buffer was originally allocated.
If we look at where the overwrite happens in populate_req_body on line 22, we can see what the destination of the write is and what might be going wrong.
void populate_req_body(Request *req, FILE *in) {
  if (strcmp(req->method, "POST") == 0) {
    char b;
    int post_size = get_cont_len(req->headers);
    for (int i = 0; i < post_size && i < MAX_POST_SIZE; ++i) {
      b = fgetc(in);
      req->body[i] = b; // <-- line 22: OOB write
    }
    printf("\n%s\n", req->body);
  }
}
The Request *req argument’s body member is being written to at a given index… but we need to look at where the struct req points to originally gets allocated.
Not only does ASAN tell us the allocation happens in request_handler, but it also shows the layout of the stack variables as well as the exact line numbers where the variable is declared in the source (thanks to debug symbols from compiling with -g).
But unless you’re familiar with this particular software or really experienced with this kind of debugging, it helps to have some better views that show the relationship between request_handler, req, and populate_req_body.
Understanding code context with pictures#
So right now we’ve looked at the debugger and ASAN views, which give us very detailed information, but it might feel like getting information by looking through a keyhole… we want to see the big picture!
That means seeing stack frames and understanding stack buffer allocation and pointers… which might sound hard, but isn’t if you’ve got the right picture!
Getting a picture of stack frames with gdb#
The first thing to see is the conceptual picture of stack frames and how the backtrace gives us an idea of the stack.
Let’s set a breakpoint on the line of the overwrite in gdb (b post.c:22) and request a backtrace with bt once we hit that breakpoint.
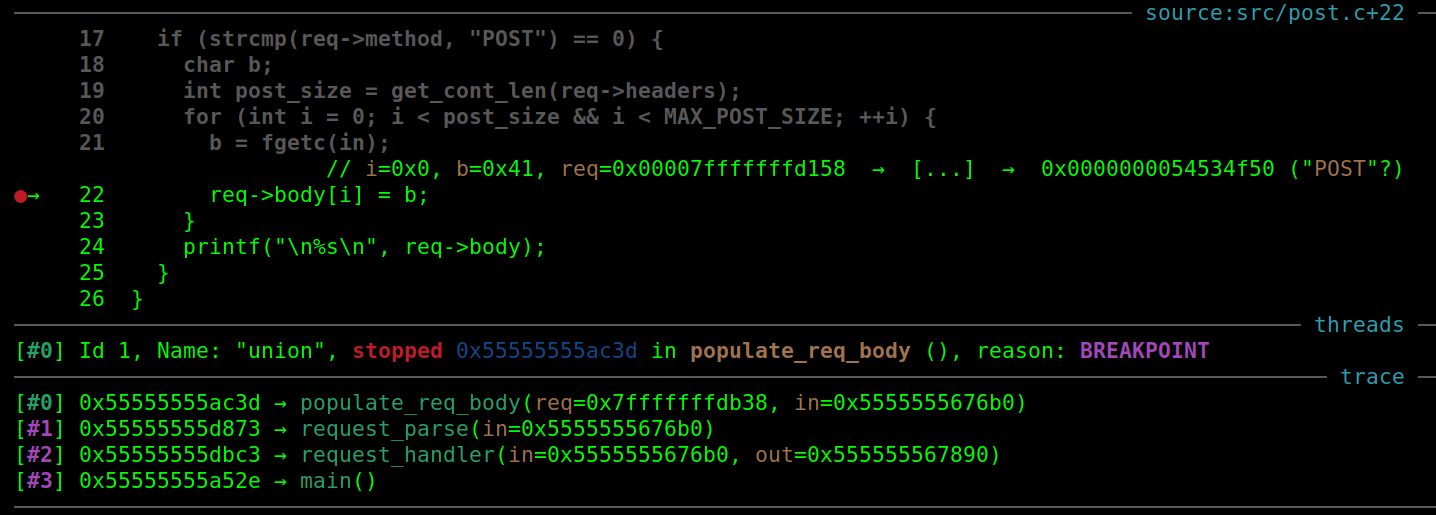
We see four entries that represent the current call stack: main called request_handler, which called request_parse, and so on.
But the key is that backtrace is a condensed version of the program stack itself.
If you’re not familiar with this concept, each function creates its own frame by pushing the old base pointer (RBP) and then “allocates” space for its local variables by subtracting the stack pointer.
On both x86 and x86_64, the return address is automatically pushed onto the stack by the CALL instruction, though on x86 arguments are passed via the stack and on x86_64 they’re passed via registers first (and so aren’t relevant for today’s target).
So let’s draw a picture to show this and help with the debugging we’re about to do.
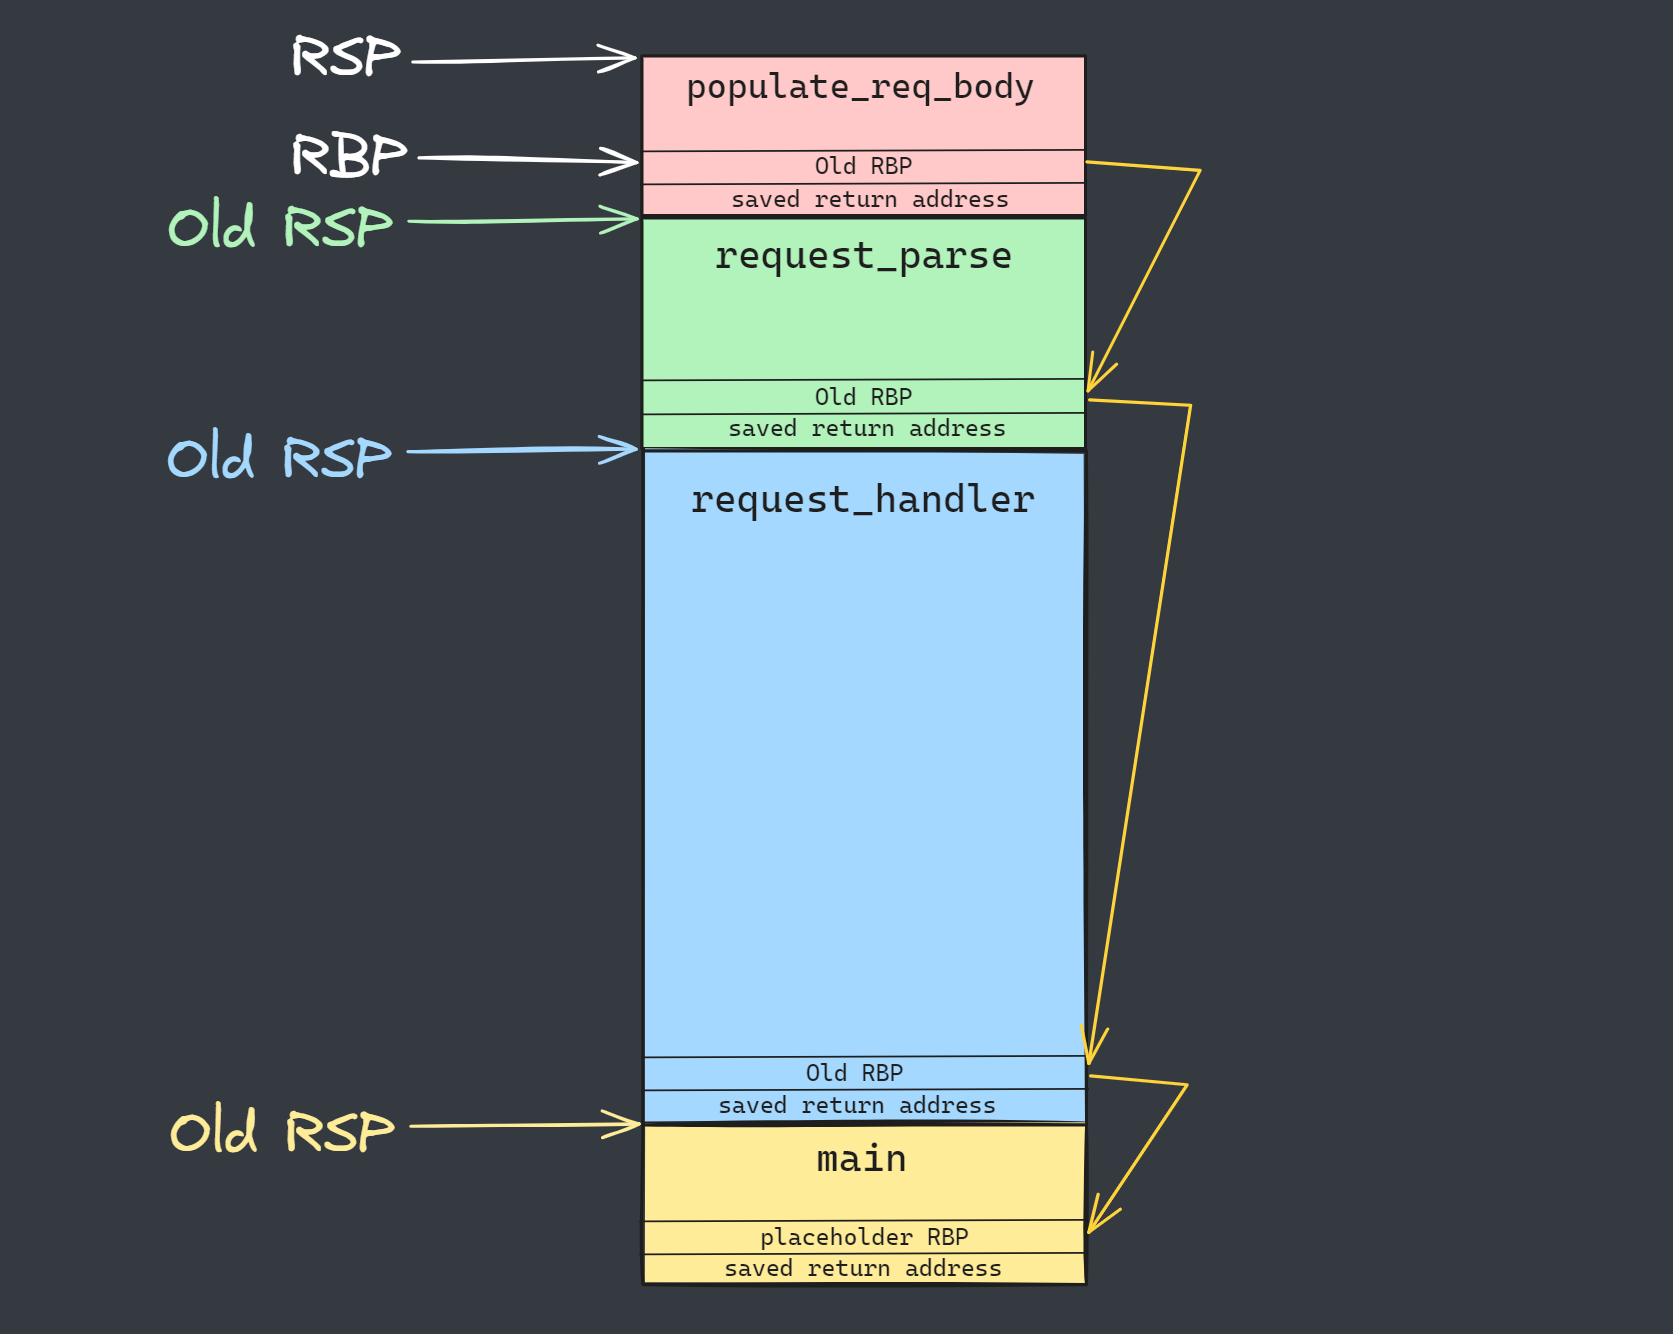
This shows the frames in the order they’re listed in the backtrace with RSP, RBP, and return address annotated for each of the stack frames.
Now if you’ve heard some debate about whether the stack grows “up” or “down”… The answer is that if a new frame is pushed onto the stack, the stack grows towards numerically smaller addresses. You can draw it either way, up or down is just a matter of perspective.
This wouldn’t be confusing if we just consistently used a diagram like the one above. Calculating addresses in our heads and inferring relationships is just not something our brains are good at, and it gets worse when we try to apply addition and subtraction to this abstract concept.
With gdb we can switch context between frames using up, down, and frame # (the top-most frame is always frame 0).
If we ever forget where we are, we can check with frame.
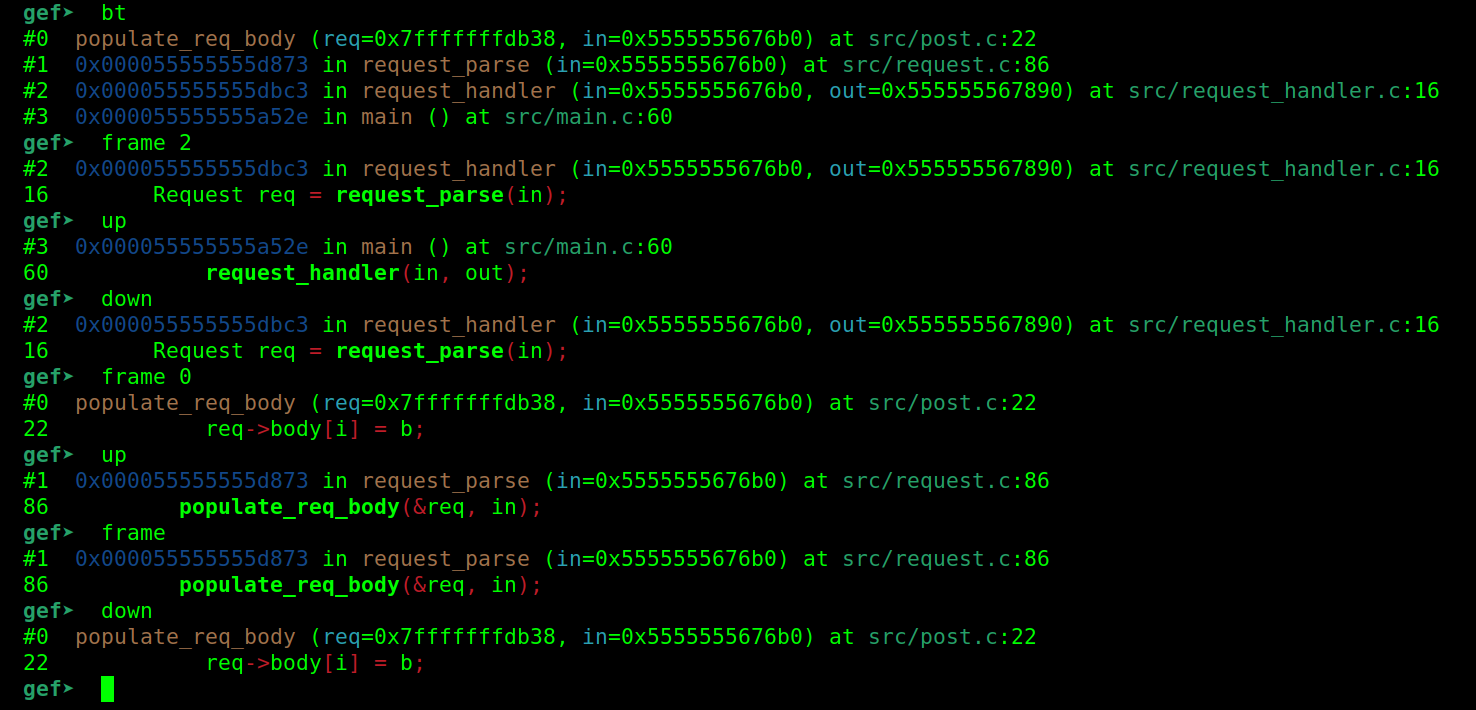
The super useful part of this is that gdb translates frame-relative stuff, allowing us to see what things look like from the point of view of that frame (things like $rsp, $rbp, local variable names, etc).
In this case we’re interested in knowing about specific variables on the stack and their layout.
Since we have debug symbols, this is pretty easy to put together with gdb, particularly some of the info subcommands, print, and telescope (only telescope is specific to gef).
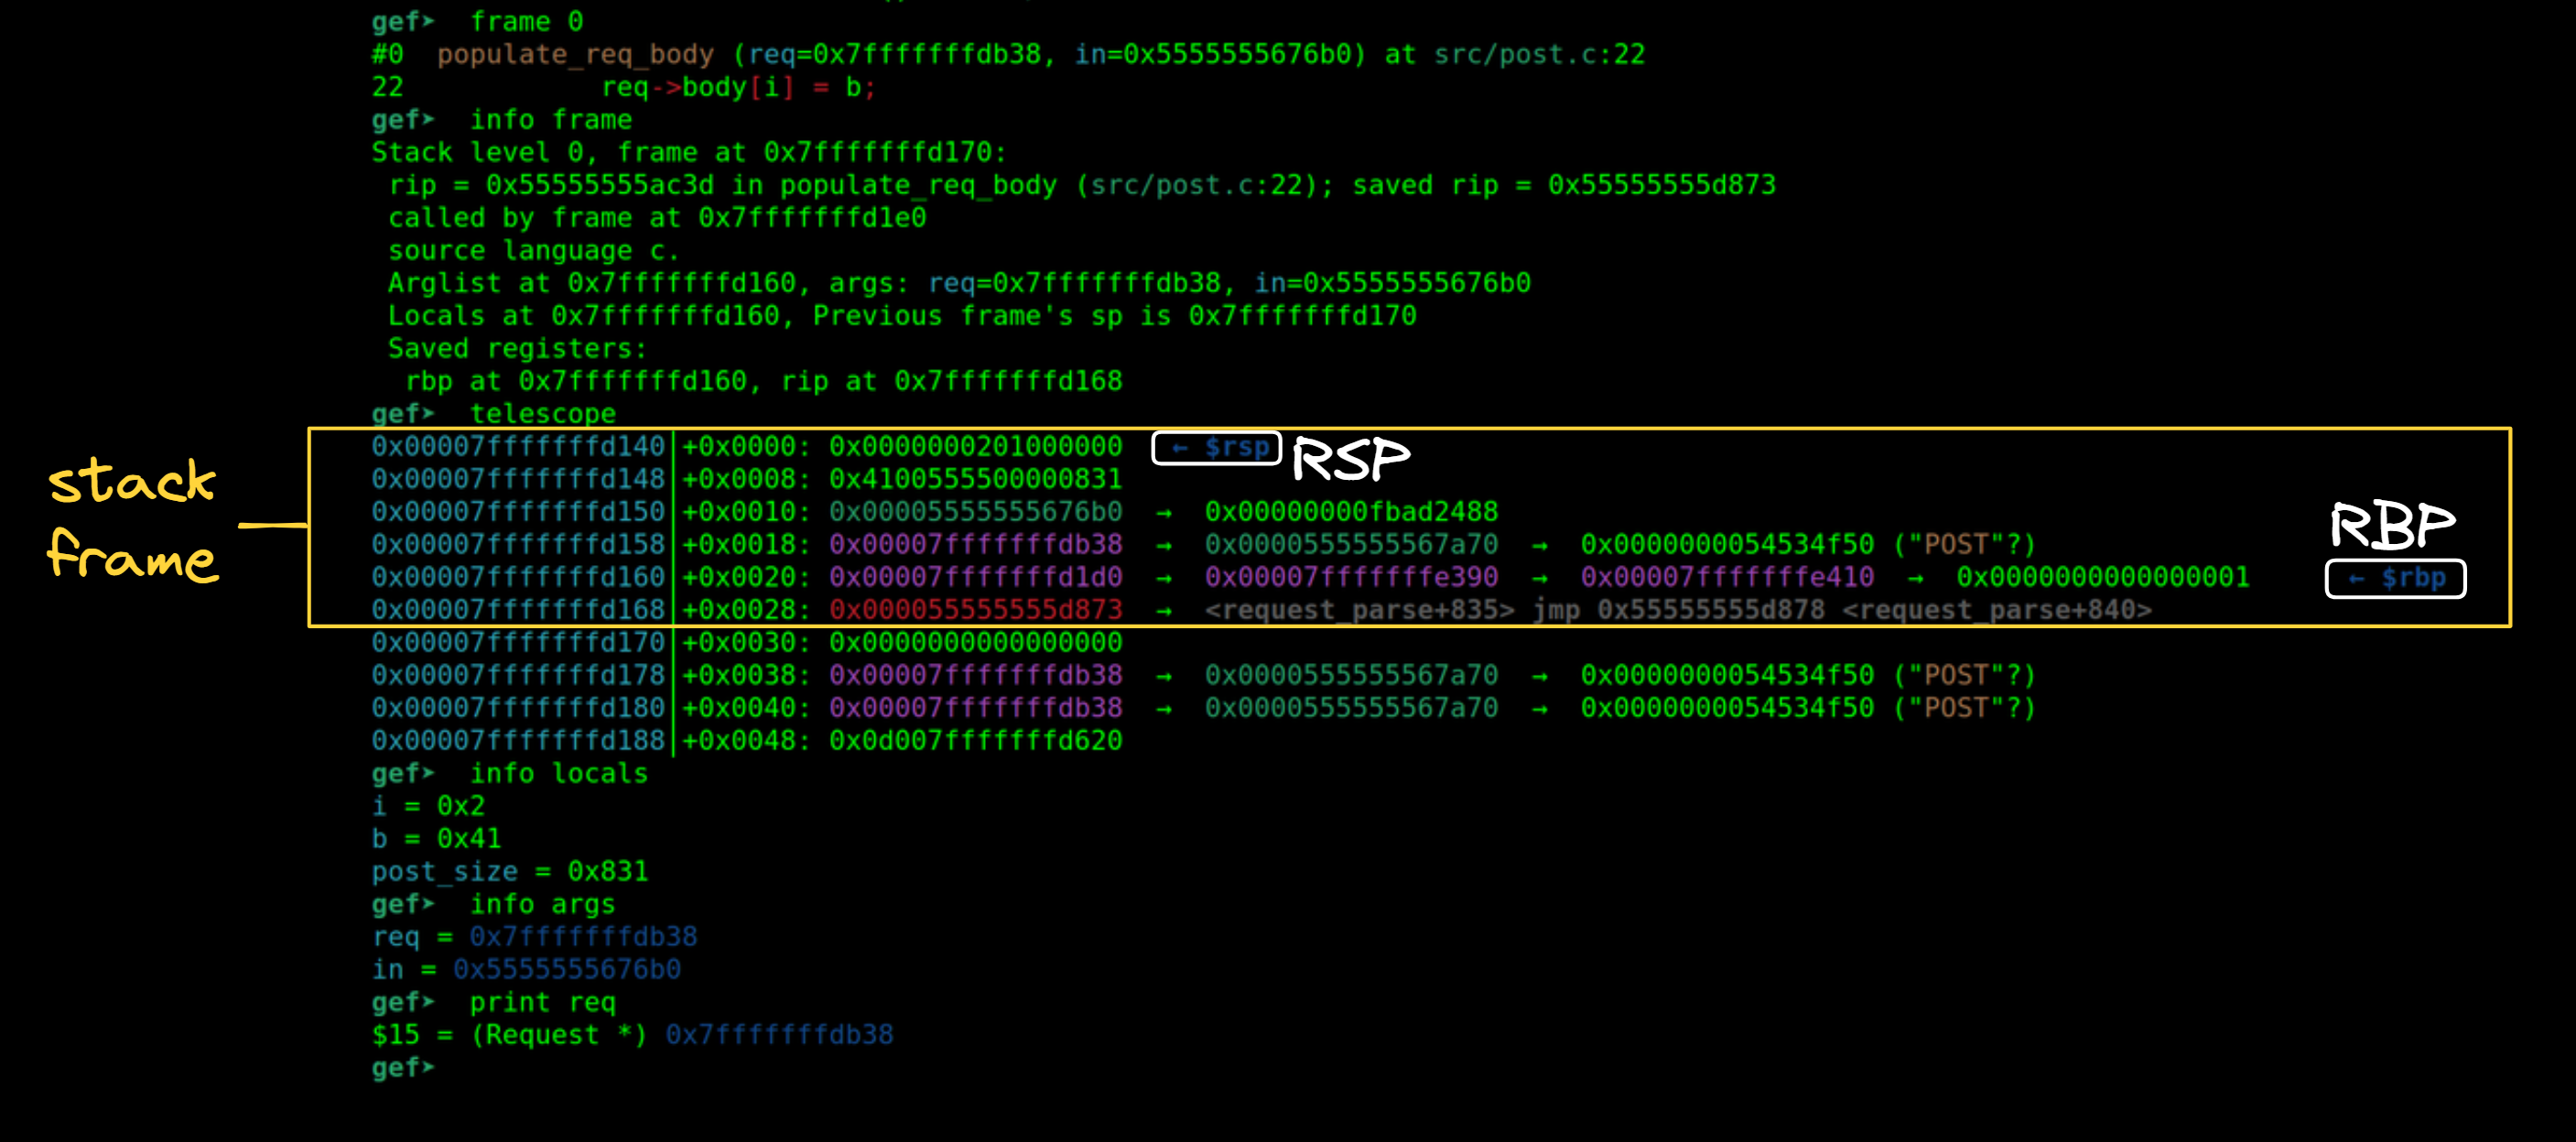
There’s a lot you can glean from info frame and info locals, but personally I find it most helpful just seeing the pattern of RSP and RBP (highlighted above because of the unfortunate blue-on-black color combo).
Ideally info locals would show us exactly which frame contains the variable, but sadly this isn’t 100% reliable.
Also, if we just try to use something like telescope to examine the stack manually, we discover that at least one of the frames is annoyingly large.
Instead, since gdb updates $rbp with the frame, we can find the frame that contains an address by using print (or p for short) to evaluate simple comparisons.
Then we just roll through the frames looking for when the target address becomes less than $rbp and greater than $rsp.
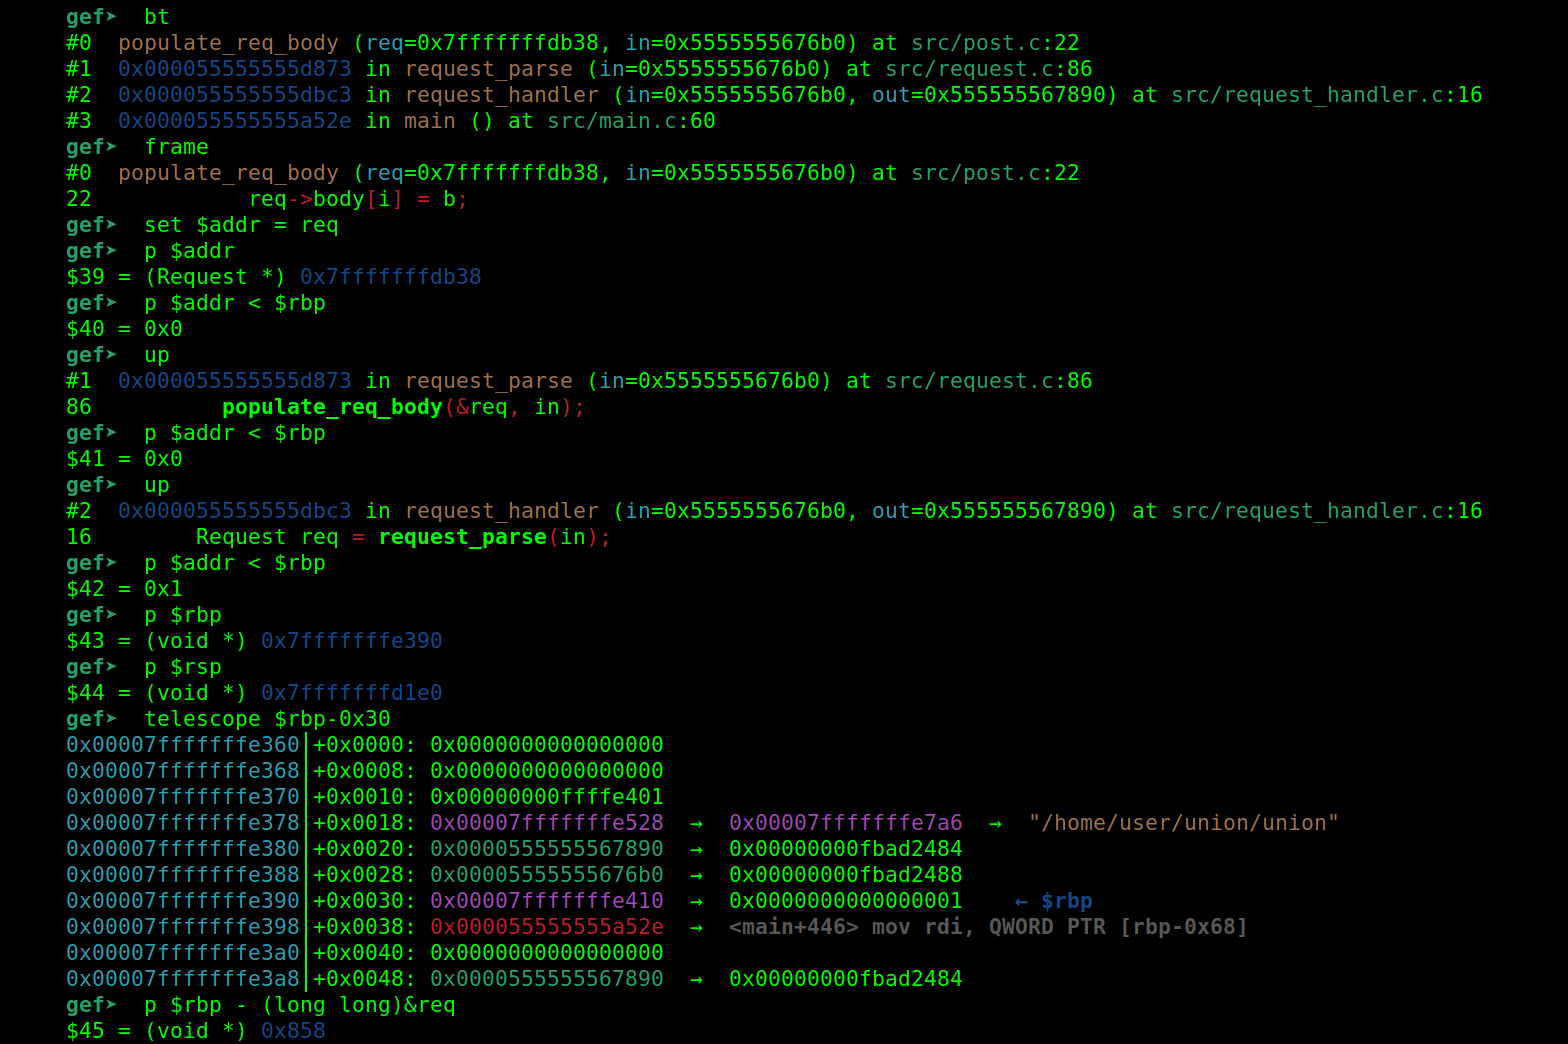
Now we have the address of req, confirmed that it is in request_handler frame, and have examined the addresses around the saved value of RBP for request_handler.
Now if we go back to the frame 0 (populate_req_body), disable the breakpoint we set, and run until the function returns with finish, we can see the result of the overflow.
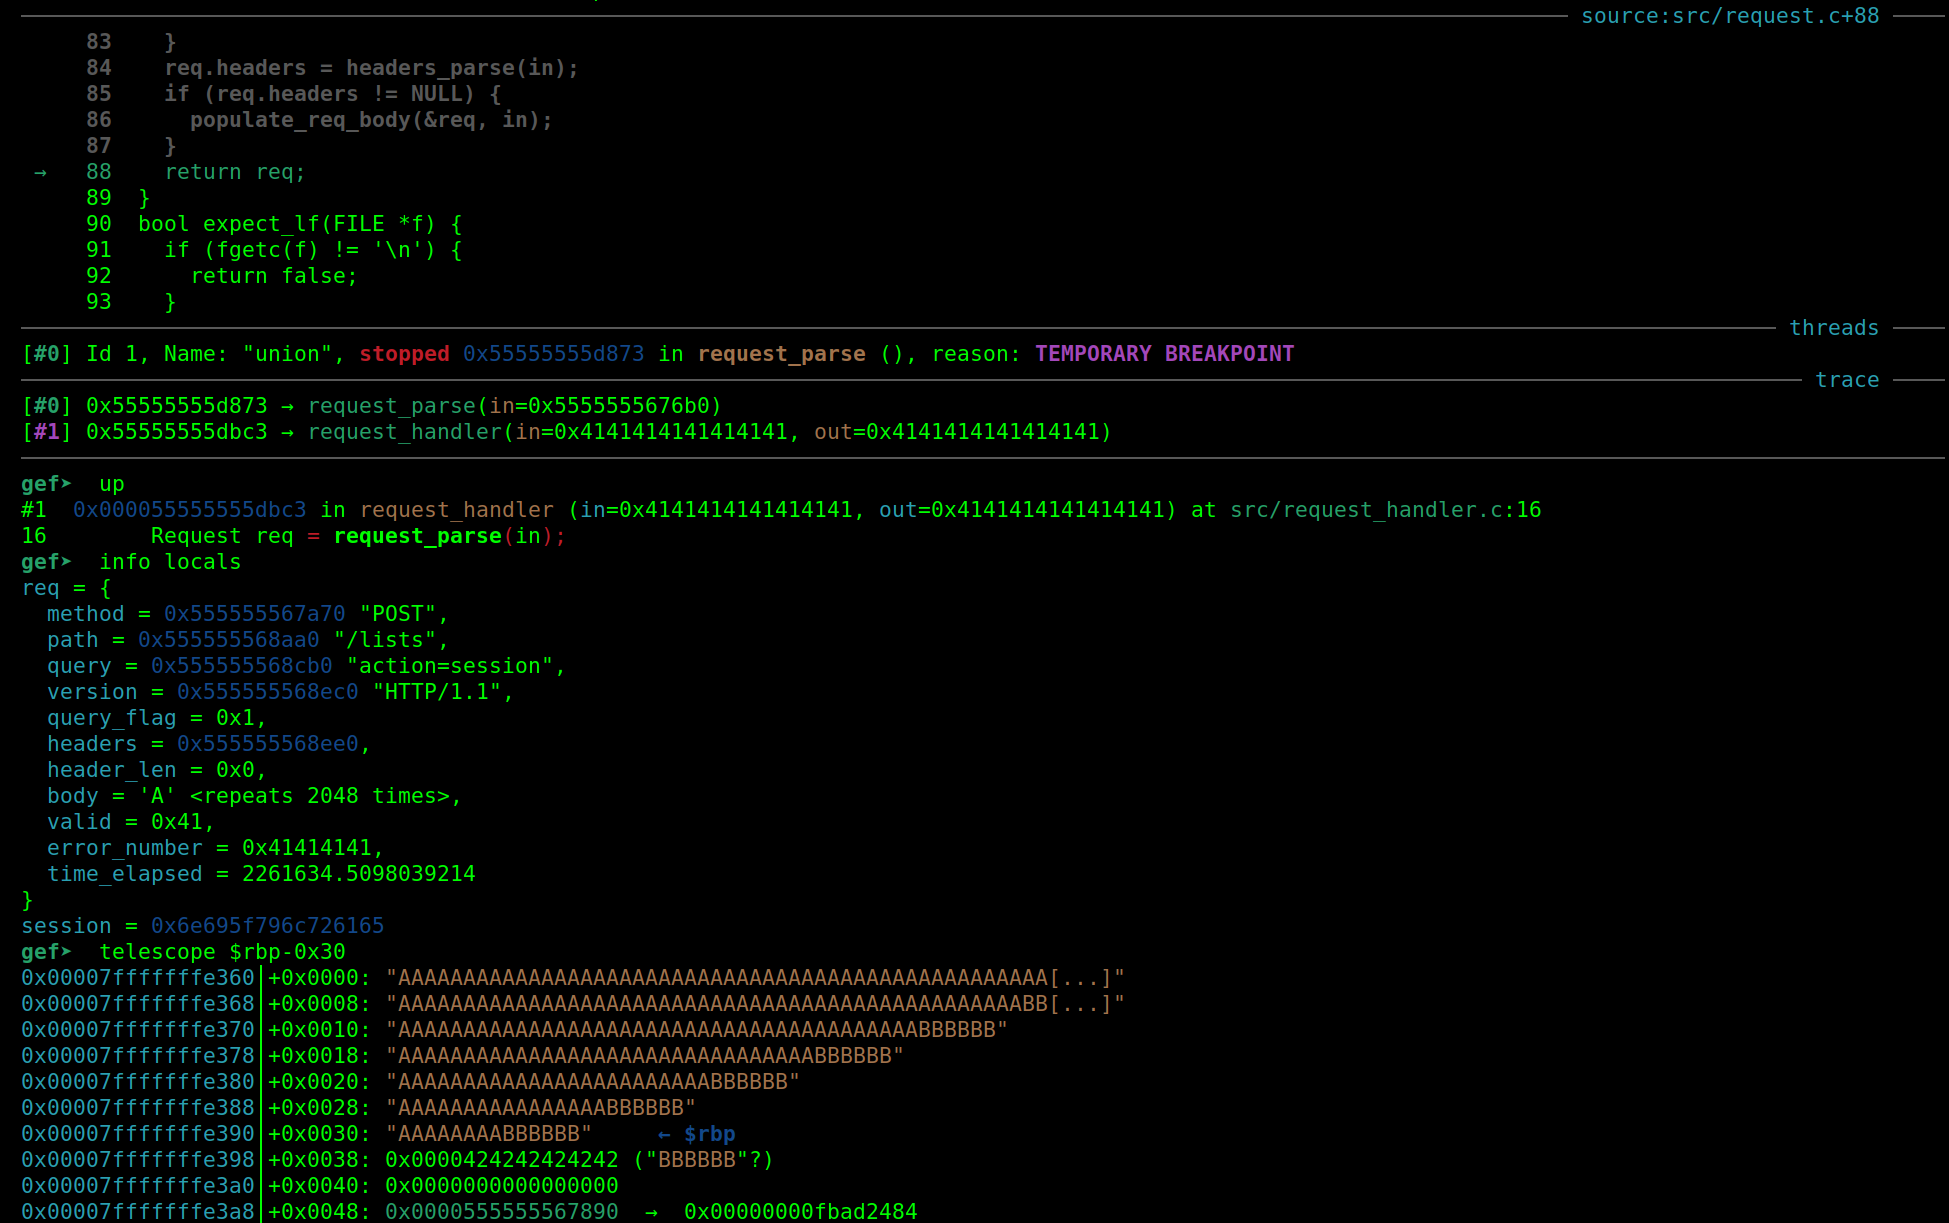
We can see that we’ve come back to the last line in request_parse, and more importantly that the request_handler frame has been clobbered by the overflow, with its saved RBP value and saved return address being overwritten.
Returning to our previous picture, we can add a little more details to show what happened during the overflow.
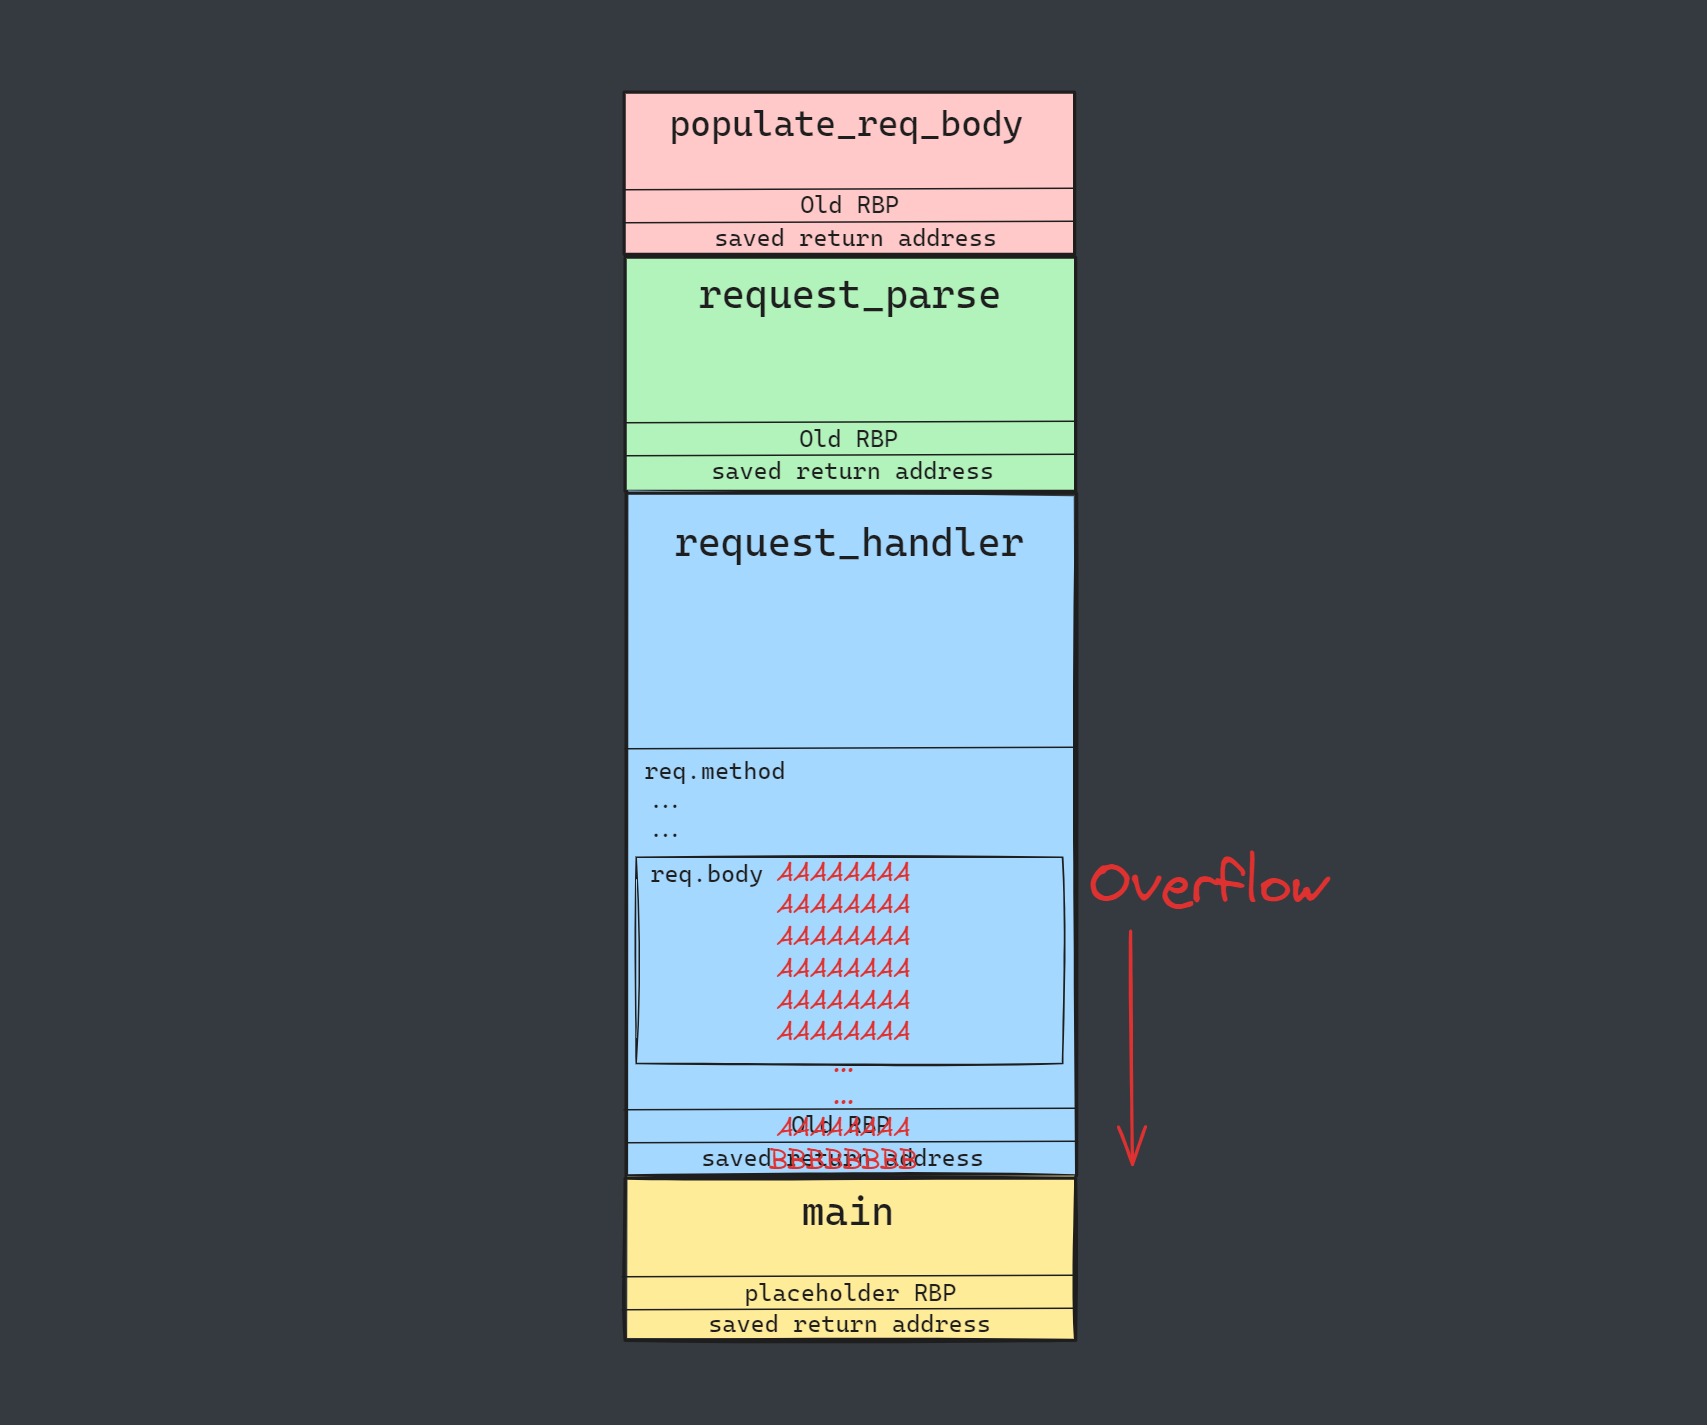
We can see how RIP ends up at a controlled address: the return address of request_handler is overwritten and the program will eventually jump there when that function finishes executing.
Now we’ve got a solid understanding of the steps of stack allocation, overflow, and control flow hijack, but there’s even more code that runs after the overflow than the four functions pictured above.
What do we do if we want to see everything that happens during the execution? We need something less linear than what a single backtrace can show.
Getting a dynamic call graph with Ariadne#
In this kind of situation, a call graph is a great tool to start orienting to the functions that got called as well as what else could have been reached, and with Binary Ninja and Ariadne, we can do this pretty easily.
We can just pop the binary into Binja, then run the Ariadne analysis and start looking at the entire binary call graph (via context menu Graph: All Functions).

Since this is a tiny binary, we could start looking at this, but there’s a better way!
First, we can recall that this static call graph shows all functions that could possibly be called, but we can start by focusing only on the functions that were exercised by the crashing input.
If we collect block coverage (for which there are multiple methods) when crashing the target, we can import that data via the Binary Ninja plugin bncov by right-clicking and selecting “Coverage Data” > “Import File”.
Now after importing that coverage to Ariadne or redoing the analysis and refreshing our graph helper, we can highlight these functions in the graph helper with the “Toggle Coverage” button.

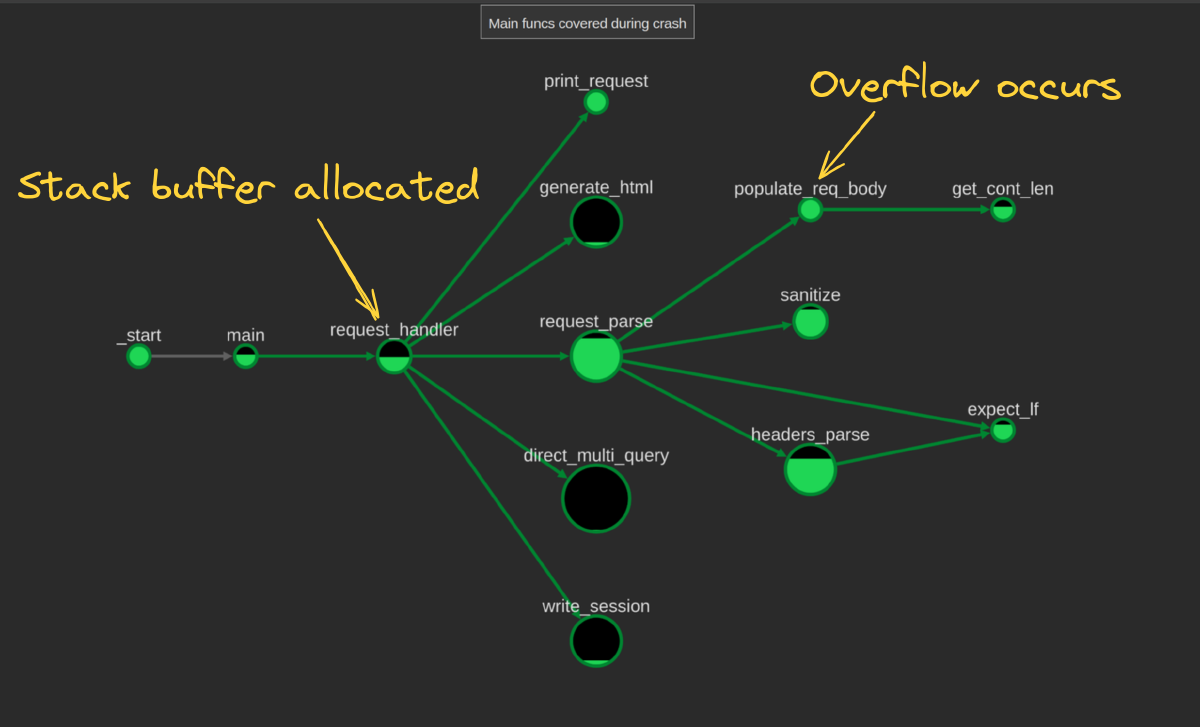
Ok, that is pretty helpful! We can easily see that there are functions in three disparate sections of the program call graph, so that’s a good place to start narrowing our view.
Two of them aren’t important (linker and loader-related functionality), so we can focus just on the one in the middle that has _start as the root at the top.
It can be helpful sometimes to look at these unconnected parts that get coverage so we understand if the static analysis missed some important links between functions, but in this case it didn’t.
Instead of having to manually clear all the extra disconnected nodes from the graph, we can just right click while inside the main function in Binary Ninja and ask Ariadne to graph the
component
containing the current function via Graph: Current function callgraph, which will only include the functions reachable from main.

Now we’ve got a more reasonable set of nodes to work with, we can start manually trimming uncovered nodes via the graph view to get to a cleaner view.
When I do this, I’m mostly looking for nodes that have a lot of in-edges (usually utility functions) or big uncovered regions of the graph via Remove Node+Descendents, and “Redo Layout”.
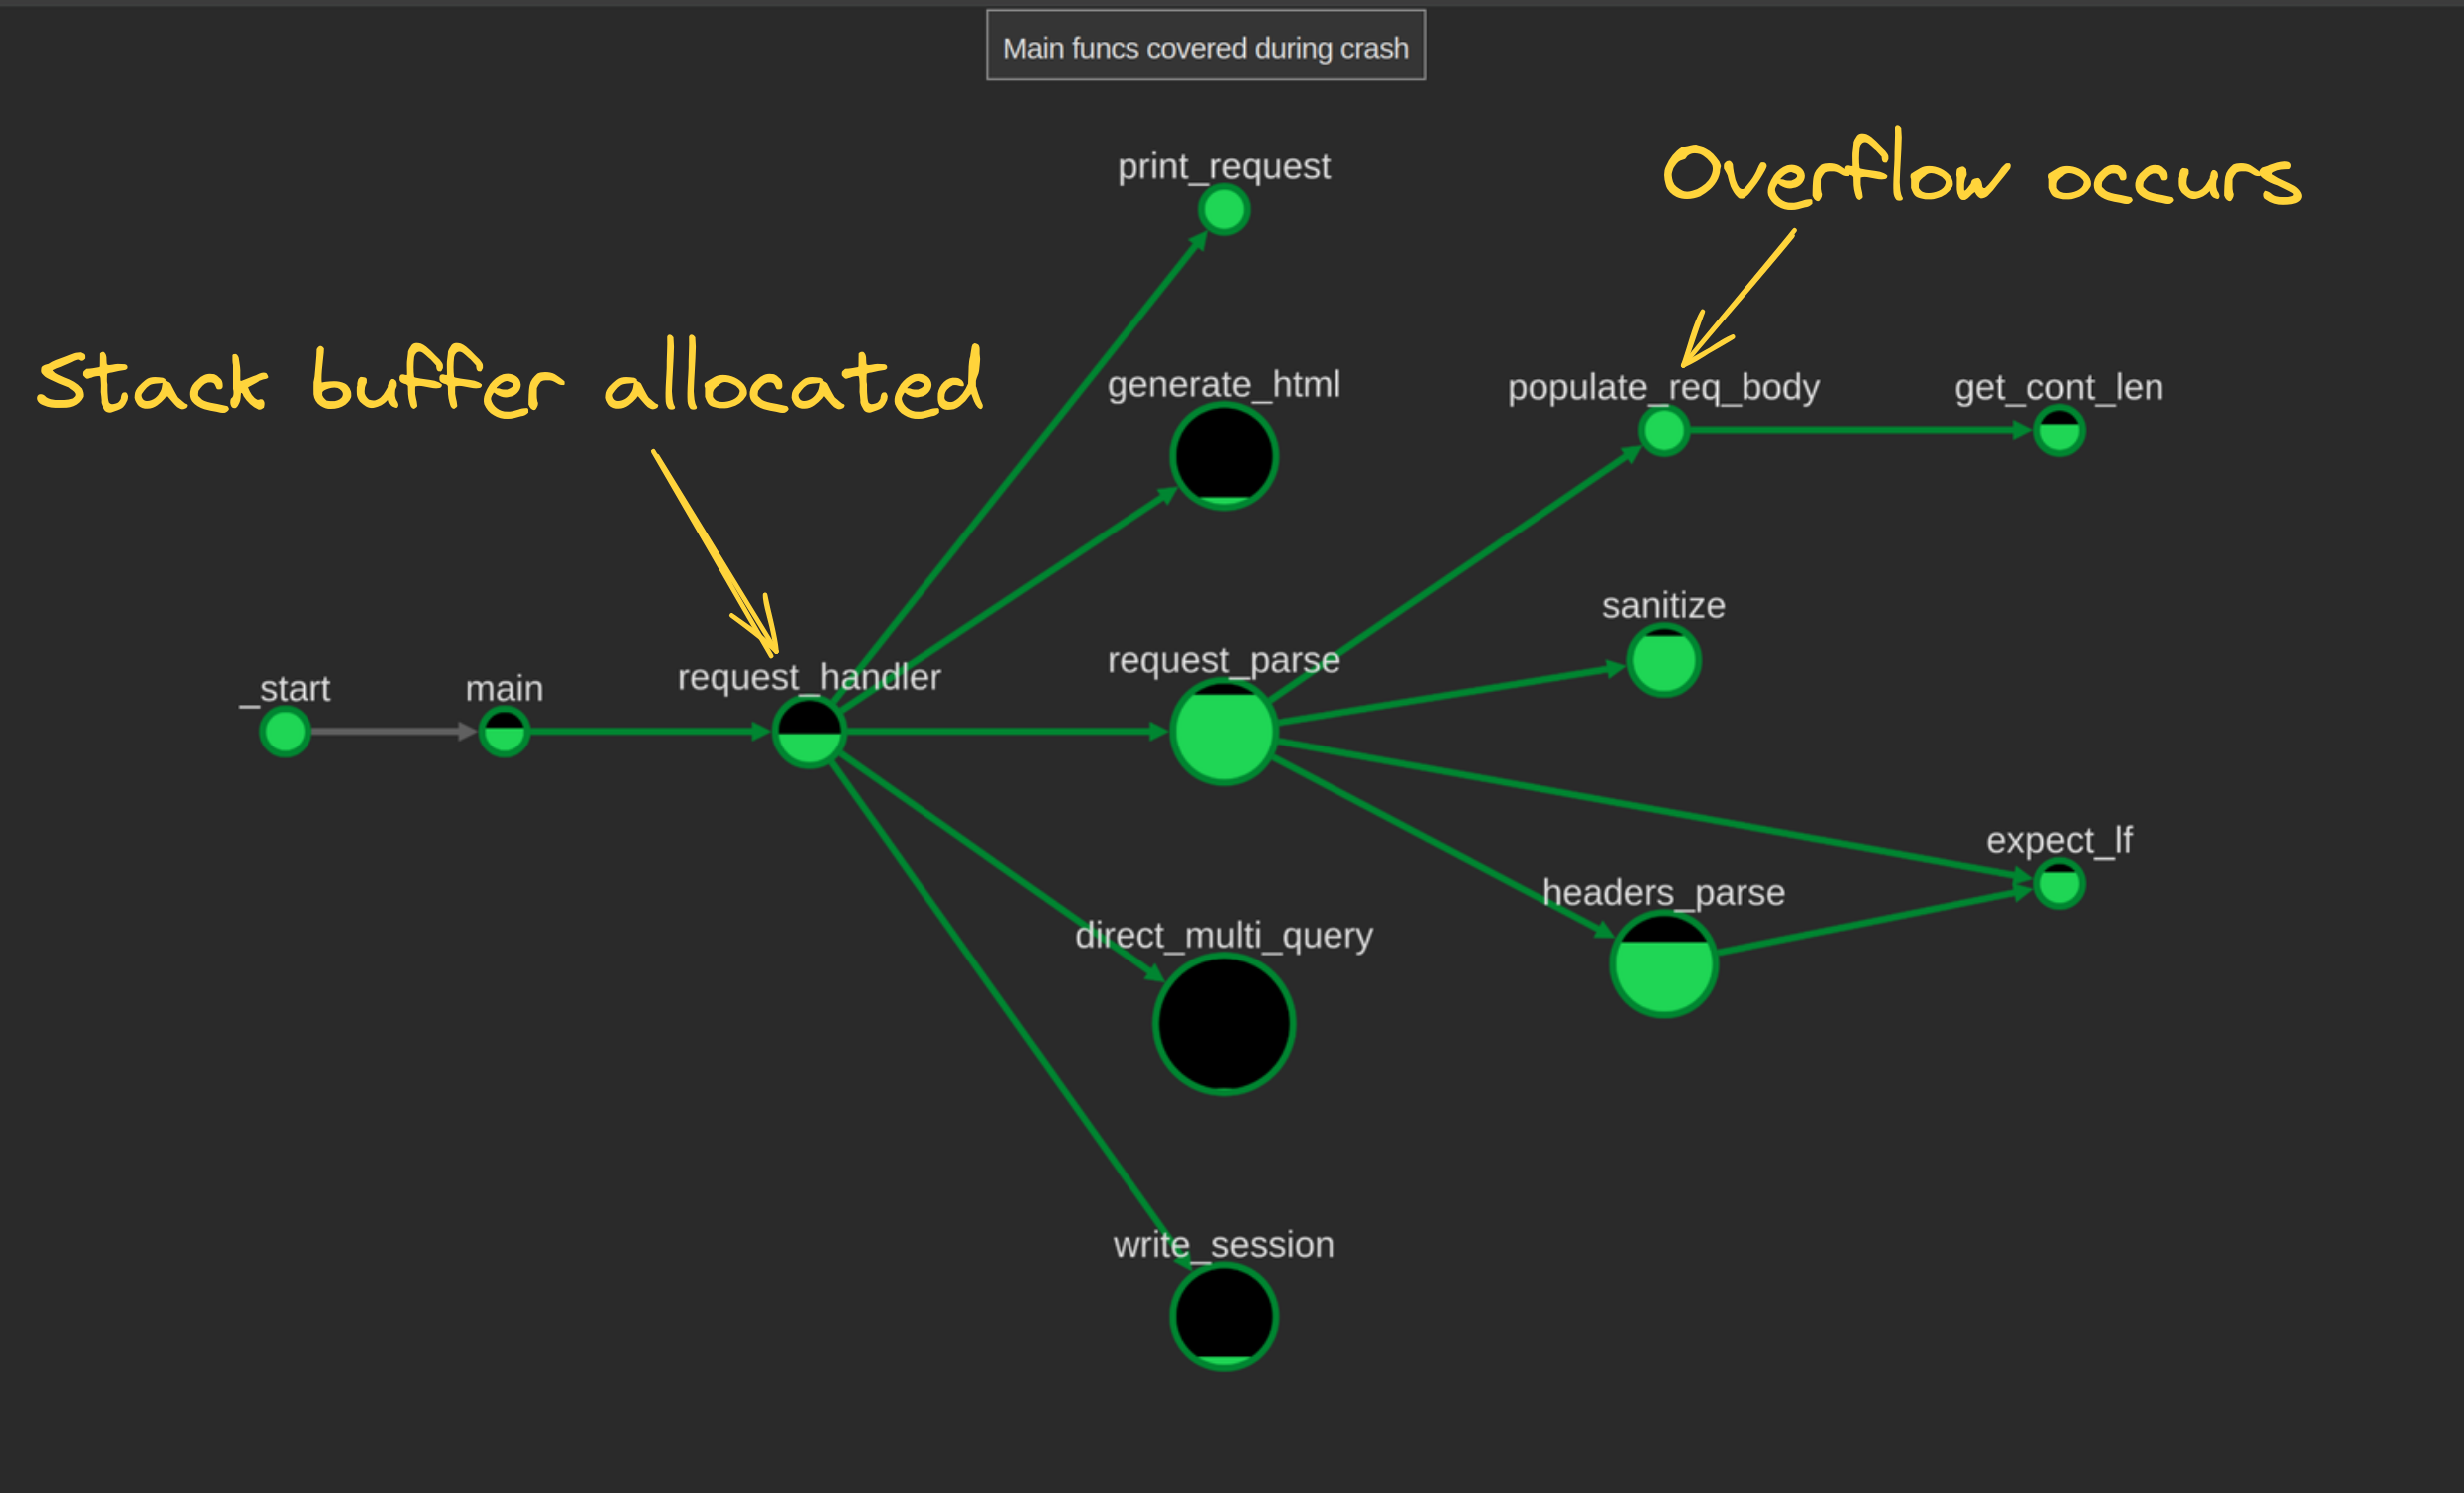
After some pruning, we end up with a more digestible graph showing which functions got covered and which ones didn’t.
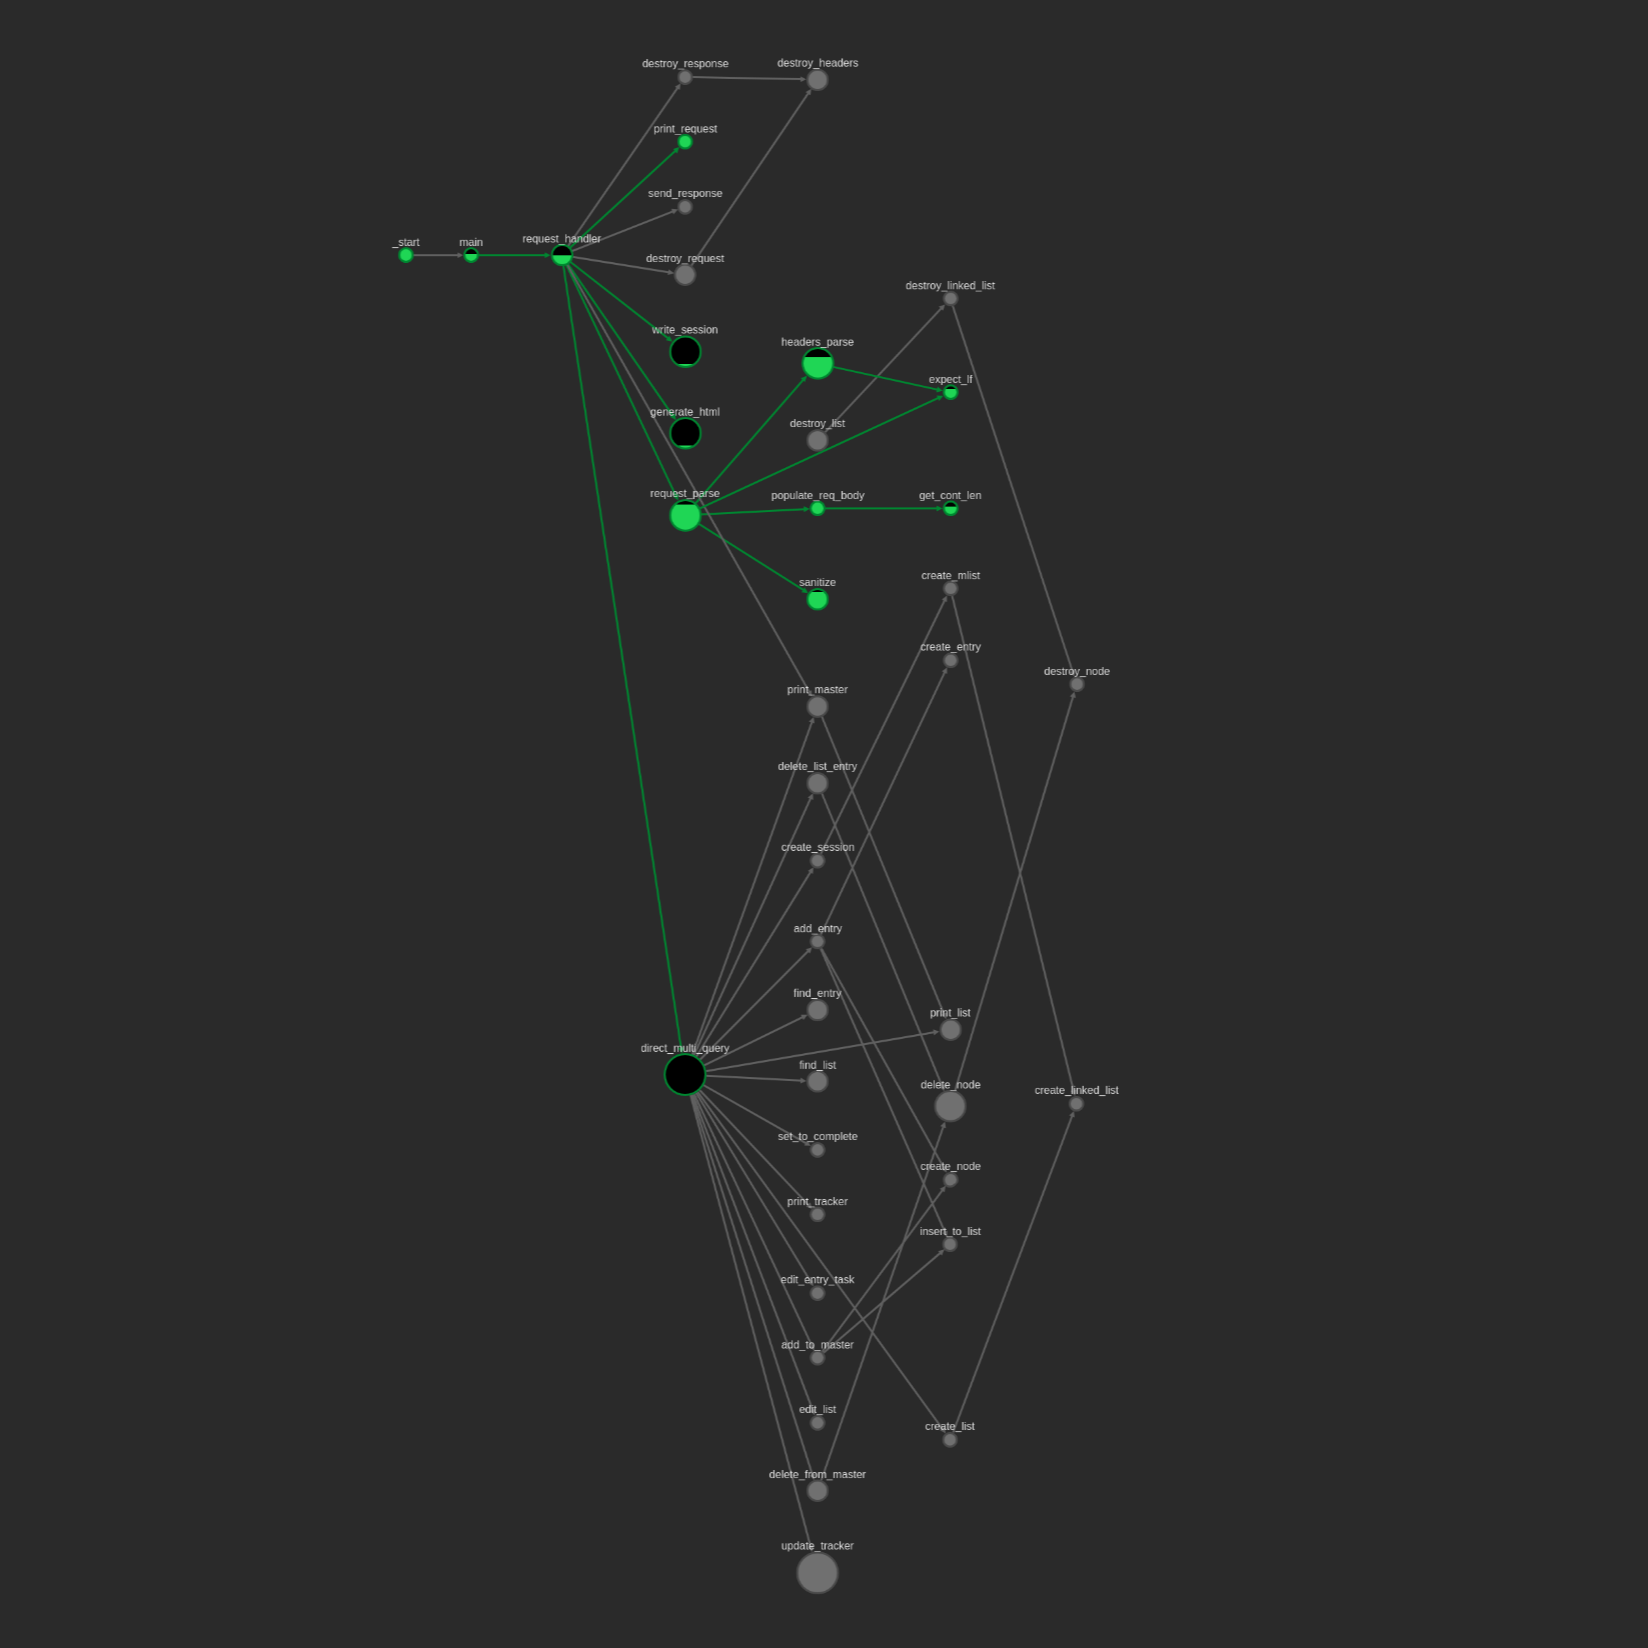
From here we can clearly see the functions that we were looking at in the debugger before, as well as the other functions that ran, plus functions that might also be reachable. Can we do better?
Saving time with scripting#
If you’re like me, you might be thinking “that takes too long, let’s automate it instead!”
I like the way you think.
Let’s take the bncov data and use it with Ariadne to programmatically filter the graph to just what we want.
Step 1: Get all the covered functions from the block coverage we collected of the crash.
import bncov

covdb = bncov.get_covdb(bv)

covered_func_dict = covdb.get_functions_from_blocks(covdb.total_coverage)
covered_funcs = [
    bv.get_function_at(start_addr)
    for start_addr in covered_func_dict.keys()
]
This should be pretty straightforward, though you may not have expected the list comprehension at the end.
It converts from the offsets (type: int) that bncov operates on to the Binary Ninja Function types that Ariadne uses as node keys in the graph.
Step 2: filter everything but the part of the graph reachable by main.
Since Ariadne lets us access the whole call graph as a DiGraph from networkx, there’s multiple ways to accomplish this.
Perhaps the most obvious way is to enumerate the connected components and find the one that includes main.
import networkx as nx
import ariadne

# Ariadne generates a "target" for each BinaryView that you analyze with it
current_target = ariadne.core.targets[bv]

# networkx calls the primary graph "G" by convention
# current_target.g is the call graph of the target as a DiGraph
g = current_target.g

# Ariadne uses class 'binaryninja.function.Function' for node keys
covered_graph = nx.subgraph(g, covered_funcs)

components = nx.connected_components(covered_graph.to_undirected())

main_component = None
for cc in components:
    if any(func_obj.name == 'main' for func_obj in cc):
        main_component = cc
        break
To show some more ideas of how helpful scripting with networkx can be, we can also show finding the largest connected component, which is a little shorter. It may not always be the case that you want the largest component, but for this binary it is.
main_component = max(nx.connected_components(sg.to_undirected()), key=len)
Step 3: Push the graph to the graph helper frontend.
main_subgraph = nx.subgraph(g, main_component)

ariadne.core.push_new_graph(
    main_subgraph,
    'Main functions covered during crash'
)
That gives us the picture we want, and we can toggle the coverage overlay on or off as we like.
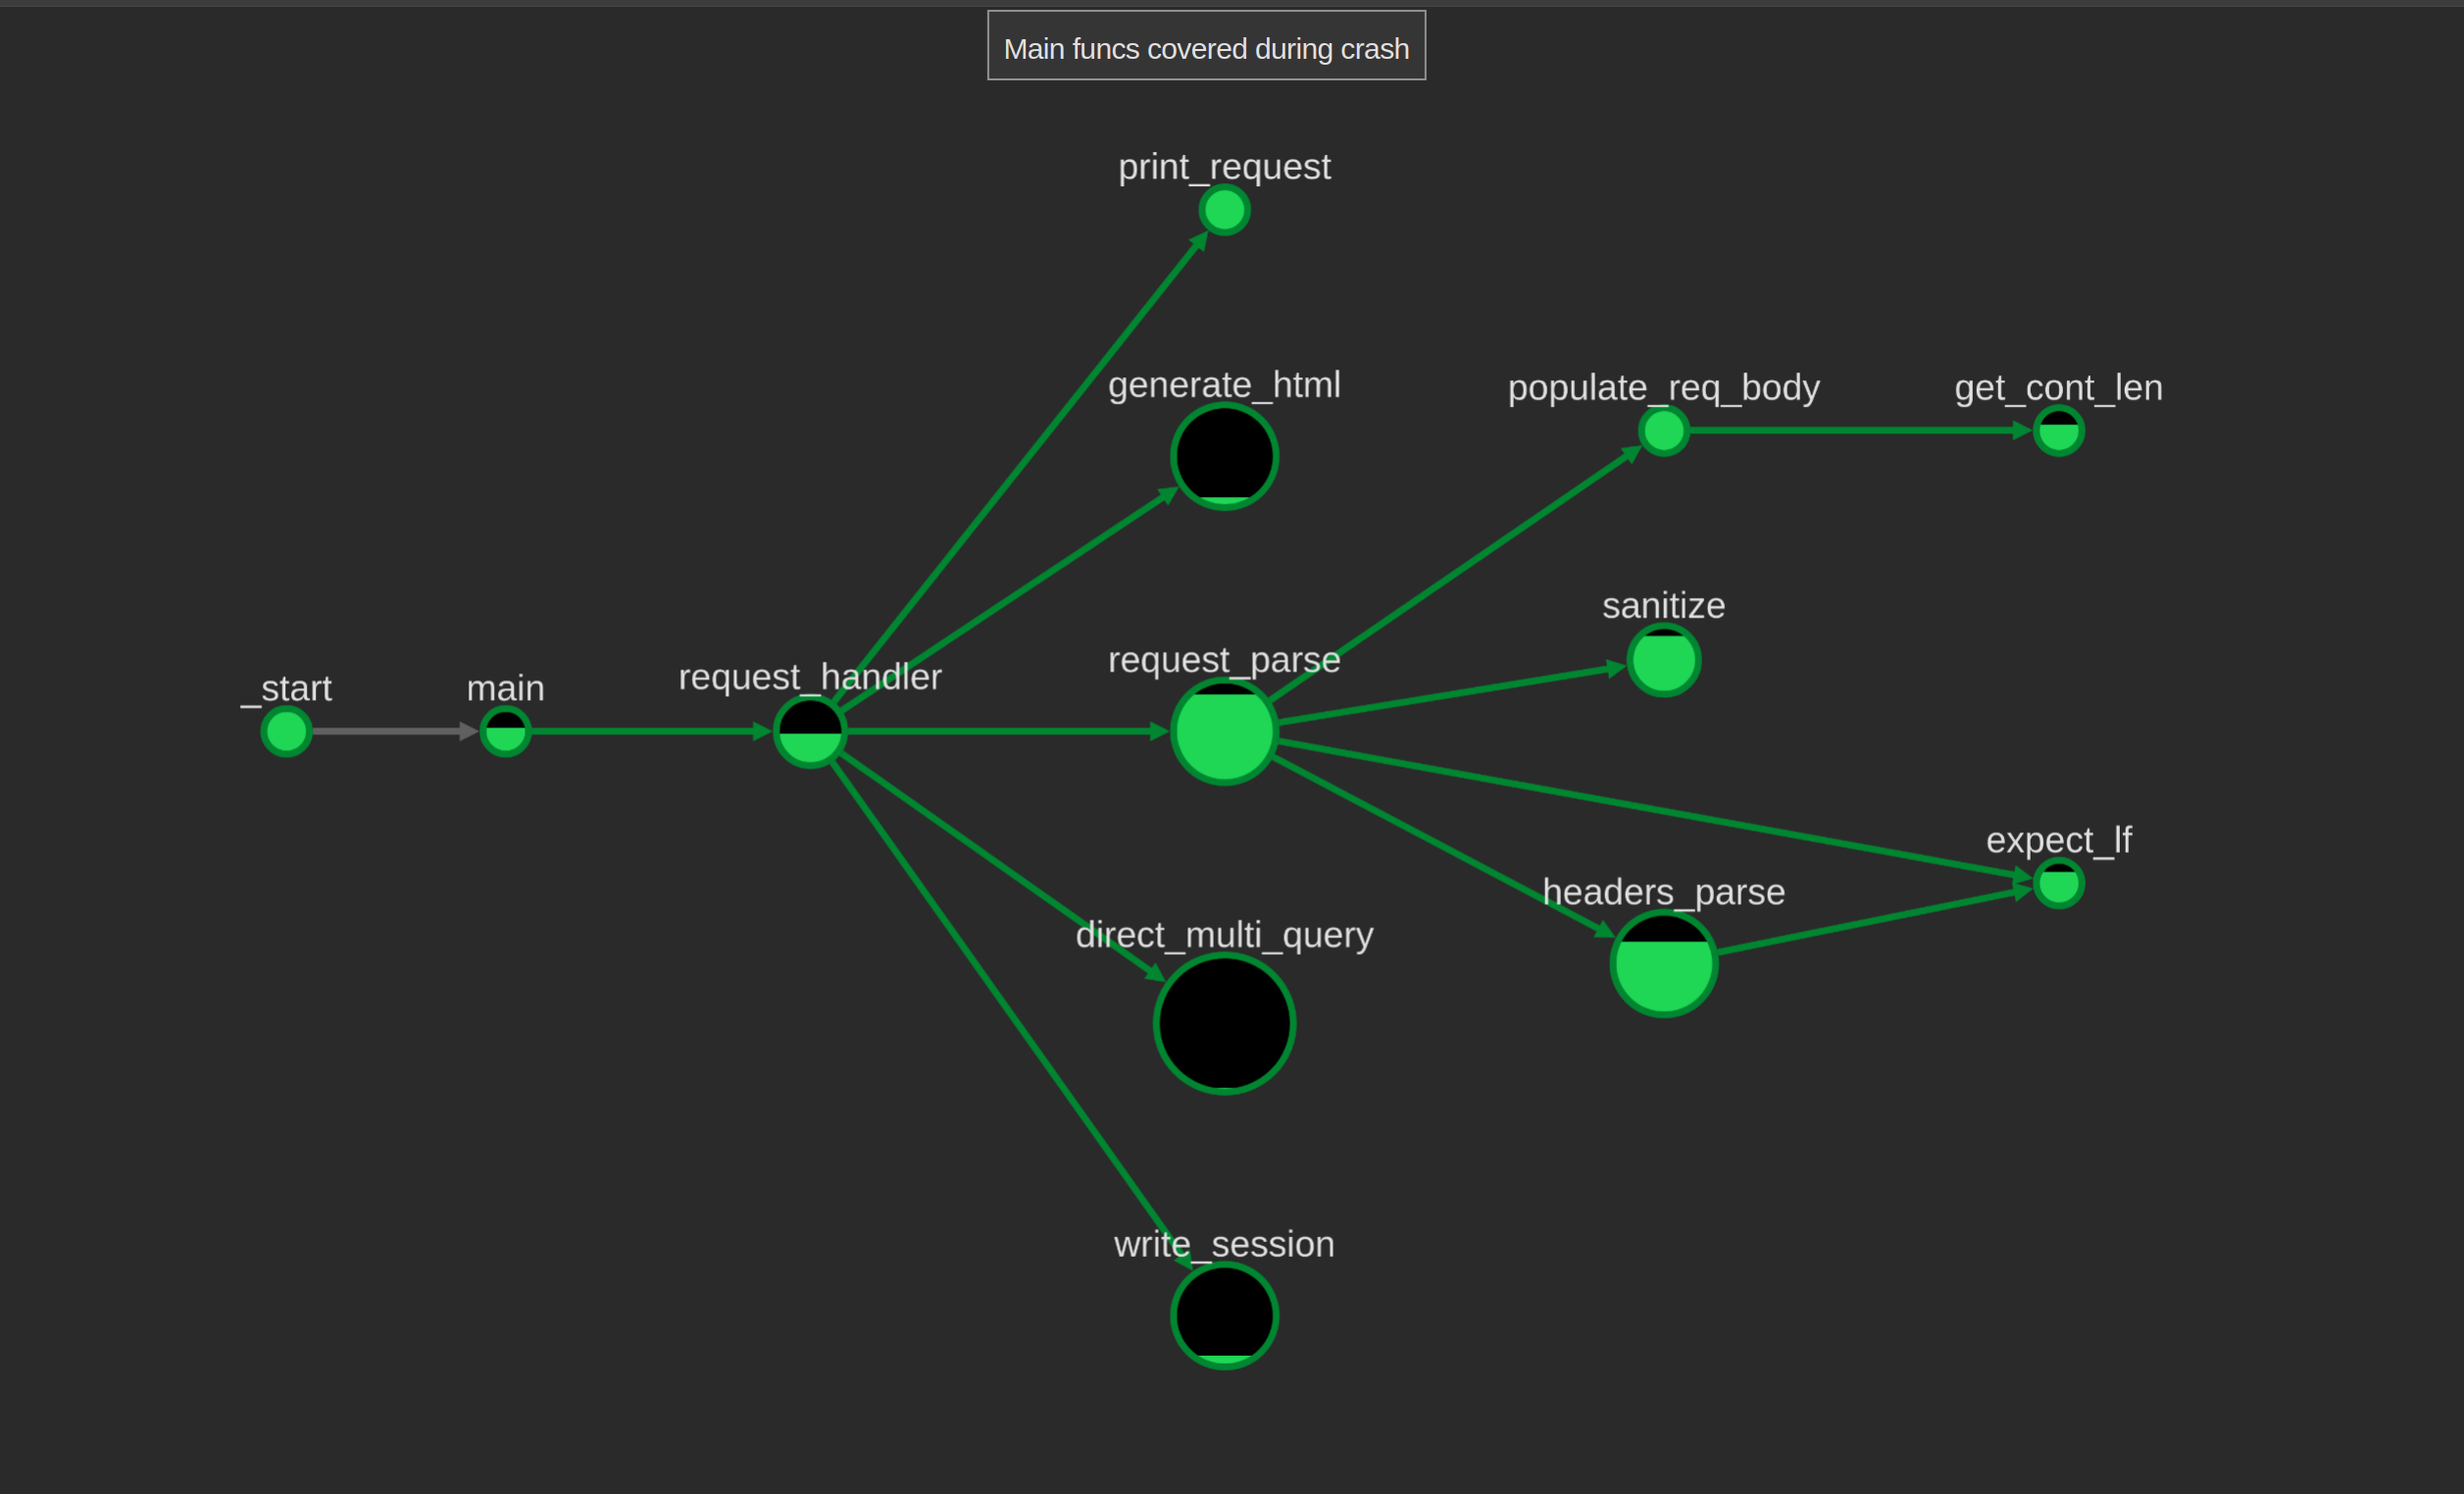
Step 4: Wrap the previous analysis in a function or snippet so you never have to rewrite it again!
# Copy this into the snippet editor for great justice
import ariadne
import bncov
import networkx as nx

# Assumes bncov has imported coverage and Ariadne analysis has been run.
# Currently graphs all functions in the largest connected component
# covered by any trace in the CoverageDB, so adjust as needed
def graph_main_covered_functions(bv):
    covdb = bncov.get_covdb(bv)
    covered_func_dict = covdb.get_functions_from_blocks(covdb.total_coverage)
    covered_funcs = [bv.get_function_at(start) for start in covered_func_dict.keys()]
    target = ariadne.core.targets[bv]
    subgraph = nx.subgraph(target.g, covered_funcs)
    main_cc = max(nx.connected_components(subgraph.to_undirected()), key=len)
    main_subgraph = nx.subgraph(subgraph, main_cc)
    ariadne.core.push_new_graph(main_subgraph, "Covered Functions in Main Component")

graph_main_covered_functions(bv)
And now we’ve encapsulated a common workflow in a sweet snippet we can bind to a hotkey and customize in the snippets editor.
That’s the delicious taste of having the time to make a sandwich because now you don’t have to click around as much.
What can you do with an overflow?#
Armed with our coverage graph, we can see the functions of interest more clearly and better understand the context around the overwrite.
As far as the impact of this bug, it would be limited if a stack canary was present, but would that really remove all potential threat?
If we look at the ASAN output or the Binary Ninja stack view to see the location of the buffer, it’s pretty close to the top of the frame in request_handler.
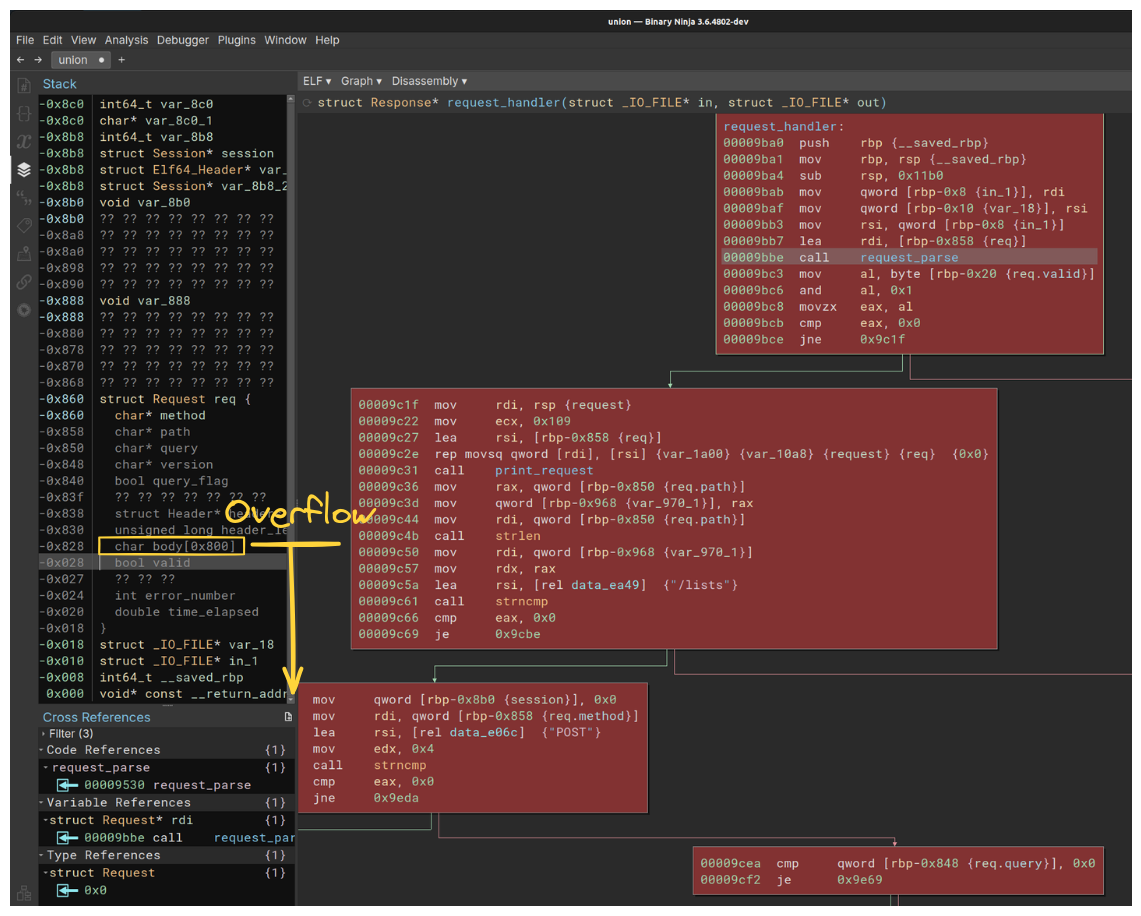
Binary Ninja’s new and improved DWARF support makes it easy to find and set the type on the stack view (as shown above) and see the offsets of different members right in the stack view.
This means there’s not a lot of options for overwriting local variables via an overflow, but maybe we could still overwrite members internal to the struct?
The fields that could be overwritten are: valid, error_number, and time_elapsed.
Not very interesting, but we let’s keep looking for a bit.
Looking at the lifetime between when the overflow happens and when request_handler returns (with the return address potentially overwritten), we’ve got three functions that may be interesting: request_handler, request_parse, and populate_req_body.
Looking at the code, we can see that not much else happens in populate_req_body, the call to which occurs at the end of request_parse, which leaves request_handler.
All of this overwrite action happens during a call near the top of request_handler, so there’s potentially a lot of functions that could be reached…

But at the end of the day, the members of the struct that get overwritten just don’t get used in any meaningful way that I could tell… if you figure something out, let me know!
In reality there are a lot of dead-ends when it comes to research, and I think it’s honest to share examples of when things don’t work out the way you’d like them to.
Ok fine, let’s fix it#
By now we are pretty well acquainted with the bug, so fixing it should be a breeze!
Recall the ASAN output originally pointed us to right where the out-of-bounds write happens:
void populate_req_body(Request *req, FILE *in) {
  if (strcmp(req->method, "POST") == 0) {
    char b;
    int post_size = get_cont_len(req->headers);
    for (int i = 0; i < post_size && i < MAX_POST_SIZE; ++i) {
      b = fgetc(in);
      req->body[i] = b; // <-- line 22: OOB write
    }
    printf("\n%s\n", req->body);
  }
}
The overflow tells us that the i index variable must be going past the end of the body array.
We can see the the index is checked against MAX_POST_SIZE (which is #defined as 4096) and post_size, which is returned from get_count_len.
Looking at get_count_len, we can see that value is taken straight from the input without checks and therefore shouldn’t be trusted.
int get_cont_len(Header *headers) {
  for (int i = 0; i < MAX_HEADER_COUNT && headers[i].name != NULL; ++i) {
    if (strcmp(headers[i].name, "Content-Length") == 0) {
      return atoi(headers[i].value);
    }
  }
  return 0;
}
This means the check against MAX_POST_SIZE must also be insufficient… let’s look definition of the target buffer (req->body) from the Request struct:
typedef struct Request {
  char *method;
  char *path;
  char *query;
  char *version;
  bool query_flag;
  Header *headers;
  size_t header_len;
  char body[2048];  // boom goes the dynamite
  bool valid;
  int error_number;
  double time_elapsed;
} Request;
Yup, there’s a hardcoded 2048 that mismatches the 4096 of MAX_POST_SIZE, so reducing the MAX_POST_SIZE is a reasonable fix. This lines up with the intended patch from the dataset, which also ensures a null terminator.
$ diff unpatched/src/post.c fully_patched/src/post.c
7c7
< #define MAX_POST_SIZE 4096
---
> #define MAX_POST_SIZE 2047
22c22
<       req->body[i] = b;
---
>       req->body[i + 1] = '\0';
This is a straightforward bug, but issues like this occur all the time in development, so solidifying mental models and improving our familiarity with tools help us pinpoint problems fast and save a lot of time in the long run.
Using practice to try new things#
If you haven’t tried out ASAN, graph workflows, or mixing up gdb and Binary Ninja usage, I hope this inspired you to give them a try, or at least sparked some new ideas on how to think about these kinds of issues.
No technique is going to be applicable to every situation, but it’s good to try new workflows, new tools, and keep our mind open for opportunities to explore the possibilities.
Stay tuned as we continue to explore visual tools and techniques to improve our understanding and see code better. Til next time!
