
Code coverage lets you see what happens when a program is executed, but what do you do if you aren’t compiling the program yourself?
In the first post of this series, we talked about the basics of coverage and how to get it with a compiler, but if you value coverage in your workflows you’ll need ways to get coverage when you only have a binary. The nice part is that if you have workflows that work for binaries, they’ll still work when you’re compiling from source.
Having different ways to collect coverage helps us leverage tools things like bncov and Ariadne to do cool analytics and visualization, which we’ll cover in our in 3-part series.
- Part 1: Code coverage explained
- Part 2: 5 ways to get coverage from a binary (this post)
- Part 3: Automated coverage analysis techniques
Tools to get code coverage from binaries#
Today we’re going to look at getting coverage from binaries, and we’ll be focused on block coverage since it is the easiest and requires the lowest overhead in terms of performance penalty and storage.
The output we’re looking for is a block coverage file for the target binary that can be processed by our coverage tools.
There are few different formats for this, but they all have to contain the same information (the address or offset of the blocks covered), so it isn’t too hard to convert between them.
We’ll stick to WinDbg’s module+offset address format and DynamoRio’s drcov format because they are already used by several coverage-related tools, and they typically look like this:
$ head test-10.modcov
fuzztest+600
fuzztest+580
fuzztest+5f8
fuzztest+689
fuzztest+50a
fuzztest+678
fuzztest+68f
fuzztest+590
fuzztest+510
fuzztest+78f

$ head -n35 test-10-drcov3-text.cov
DRCOV VERSION: 3
DRCOV FLAVOR: drcov-64
Module Table: version 5, count 20
Columns: id, containing_id, start, end, entry, offset, preferred_base, path
  0,   0, 0x0000000000400000, 0x0000000000401000, 0x0000000000400590, 0000000000000000, 0x0000000000400000,  /home/user/bncov/tutorial/example/fuzztest
  1,   0, 0x0000000000600000, 0x0000000000602000, 0x0000000000400590, 0000000000000e10, 0x0000000000600000,  /home/user/bncov/tutorial/example/fuzztest
  2,   2, 0x0000000072000000, 0x0000000072001000, 0x00000000720011d0, 0000000000000000, 0x0000000072000000,  /home/user/DynamoRIO-Linux-9.0.1/tools/lib64/release/libdrcov.so
...snip...
 19,  16, 0x00007f593303f000, 0x00007f5933052000, 0x00007f5932e53f50, 00000000002148f0, 0x0000000000215000,  /usr/lib/x86_64-linux-gnu/libc.so.6
BB Table: 2387 bbs
module id, start, size:
module[  7]: 0x000000000001e2b0,   8
module[  7]: 0x000000000001f050,  95
module[  7]: 0x000000000001f0af,  49
module[  7]: 0x000000000001f0fa,   6
module[  7]: 0x000000000001f0e9,  17
module[  7]: 0x000000000001f100,  12
module[  7]: 0x000000000001f10c,  14
module[  7]: 0x000000000001f128,  16
module[  7]: 0x000000000001f5f0,  16
I used bncov’s Import File action to visualize these traces and quickly confirm the coverage collection is sane, but you could use whatever you like.
At a high level, you only need two things to get block coverage 1) the location of each basic block is, and 2) a way to tell if a block gets hit during execution. Some of the tools mentioned below can do both, but in the cases that they can’t, you can always use reverse-engineering tools like Binary Ninja, Ghidra, Radare2, or IDA to cover the first requirement.
As for the second requirement, we’ll explore 5 different methods ranging from obvious to some slick tools that inflict minimal overhead: scriptable debugger, time-traveling debugger, emulator, dynamic binary instrumentation, and static rewriting,
How to get edge coverage from binaries#
Quick aside: these same tools and techniques can be adapted to record branch or path coverage if you need that (for example if you’re fuzzing and you want AFL-style edge coverage), and some of these even have tools/modes specifically for that. Keep in mind that you can always convert path or branch coverage traces to block coverage, but not the other way around!
Check out the previous post if you need a refresher on any of the concepts or terms related to code coverage.
How to get code coverage with a scriptable debugger#
Let’s start with the obvious: a debugger can single-step through a program and record each instruction… but that would be super slow and inefficient.
We can be a bit smarter about this and use a scriptable debugger to set breakpoints at the beginning of each basic block and remove them once they’re hit. This makes the overhead more bearable, but it’s still more of a last resort than a preferred approach.
I’m going to use Binary Ninja since it provides both a way to find blocks as well as a scriptable debugger, but you could use different tools for both parts (like Ghidra to find basic blocks and LLDB for your debugger).
Finding basic blocks with Binary Ninja’s API is very simple once your target is loaded:
block_offsets = set(b.start - bv.start for b in bv.basic_blocks)
print(len(block_offsets))
Enumerating the blocks is fast, but the recording while executing part is not… at the time of writing I’d only recommend running it as a headless script since the time it takes for the GUI to update only slows things down.
That being said, the skeleton of an implementation is really easy to write, and concisely shows the concept that all of these techniques end up performing:
from binaryninja.debugger import *

# Gather basic info and start debugger controller
block_offsets = set(b.start - bv.start for b in bv.basic_blocks)

dbg = DebuggerController(bv)
dbg.launch()

module = next(m for m in dbg.modules if m.name == bv.file.filename)

# Set a breakpoint on each block
for offset in block_offsets:
    mod_offset = ModuleNameAndOffset(
        bv.file.filename,
        offset
    )
    dbg.add_breakpoint(mod_offset)

# Run the target until it stops
offsets_covered = set()
while True:
    reason = dbg.go_and_wait()
    # If we hit a breakpoint, remove it
    if reason == DebugStopReason.Breakpoint:
        stop_addr = dbg.ip
        dbg.delete_breakpoint(stop_addr)
    else:
        print(f'Stopped for reason {reason}, finishing coverage')
        break

# Write out block coverage in module+offset format
with open('coverage.modcov', 'w') as f:
    for offset in offsets_covered:
        f.write(f'{module}+{offset:x}\n')
But it is interesting to watch…

This may seem like just a bad idea, but it turns out this approach is also what Brandon Falk’s Mesos does, which includes a lightweight Windows debugger (written in Rust, naturally) that is purpose-built to do this in a performant manner.
The Mesos repo includes scripts for using IDA or Ghidra (extra for BN fans) to find block offsets, and the main executable records and outputs coverage in a custom text format that includes module+offset information.
What could be better than this?
How to get code coverage with a time-traveling debugger#
Well if you’re lucky enough to have a debugger that has robust support for “time-traveling debugging” (TTD) or “reversible debugging” on your platform–that is really a great thing.
Windows users are lucky in this case, because WinDbg’s TTD (newly out of “Preview” status) is pretty solid and it’s easy to record targets and then turn that into coverage information.
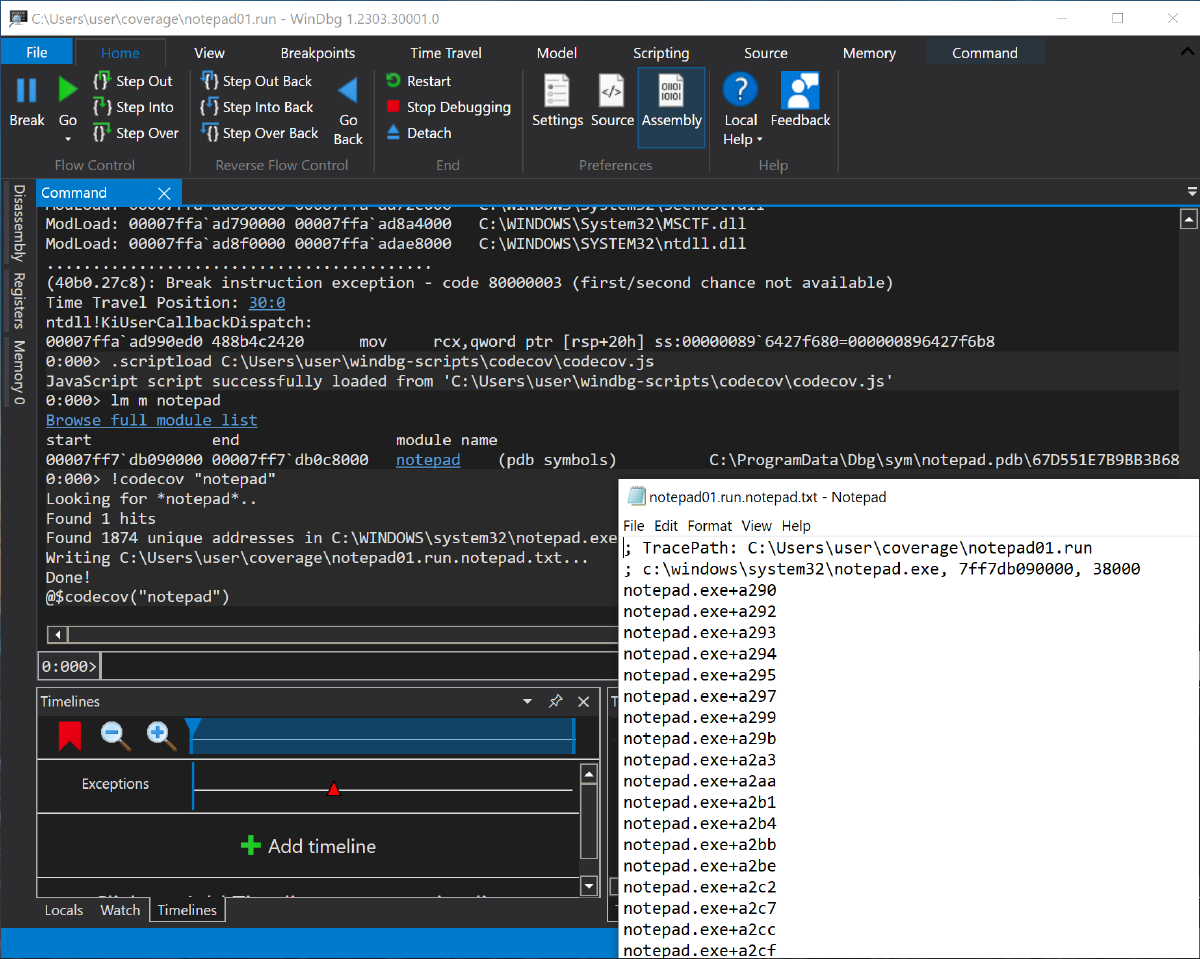
We’ll use 0vercl0k’s codecov.js script to parse coverage from the traces, so download that from here and note the path.
Record your target by either launching a process from the debugger or attaching to an existing process, just make sure you check the box to enable TTD!

Once you finish recording the execution, open the trace file (.run extension) in WinDbg.
To run the script, use .scriptload C:\path\to\codecov.js and then !codecov "modulename" for the executable/DLL you to get module+offest information saved to a file, like in the screenshot below.

Again, this isn’t necessarily the fastest way of getting coverage since you have to collect the TTD traces first (and they are some BIG files), but this is really useful if you want to use something like bncov to reason about the differences between multiple traces.
But enough with the debuggers, time to get weird with our techniques…
How to get code coverage with an emulator#
Since an emulator processes every instruction that a target runs, we can also use emulators to collect coverage… even for binary targets that we can’t run natively!
QEMU can execute Linux usermode programs for other architectures (or our native architecture 🧐), and we can use -d in_asm to output the instructions that the emulated target executes:
qemu-arm -d in_asm -D inst_trace.txt -- ./arm-static-readelf -l arm-static-readelf
Granted you’ll have to either be working with a statically linked target or have libraries for the foreign architecture (the -L in the invocation above), but I’m sure you can find some helpful info that could get you started.
The output from in_asm should contain data that looks like this:
----------------
IN:
0x00010bb8:  e3a0b000      mov  fp, #0  ; 0x0
0x00010bbc:  e3a0e000      mov  lr, #0  ; 0x0
0x00010bc0:  e49d1004      pop  {r1}            ; (ldr r1, [sp], #4)
0x00010bc4:  e1a0200d      mov  r2, sp
0x00010bc8:  e59f3018      ldr  r3, [pc, #24]   ; 0x10be8
0x00010bcc:  e52db004      push {fp}            ; (str fp, [sp, #-4]!)
0x00010bd0:  e52d0004      push {r0}            ; (str r0, [sp, #-4]!)
0x00010bd4:  e52d3004      push {r3}            ; (str r3, [sp, #-4]!)
0x00010bd8:  e59f300c      ldr  r3, [pc, #12]   ; 0x10bec
0x00010bdc:  e59f000c      ldr  r0, [pc, #12]   ; 0x10bf0
0x00010be0:  eb015c43      bl   0x67cf4

----------------
IN:
0x00067cf4:  e92d43f0      push {r4, r5, r6, r7, r8, r9, lr}
0x00067cf8:  e2814001      add  r4, r1, #1      ; 0x1
0x00067cfc:  e24dd0b4      sub  sp, sp, #180    ; 0xb4
0x00067d00:  e0824104      add  r4, r2, r4, lsl #2
0x00067d04:  e5927000      ldr  r7, [r2]
0x00067d08:  e1a08000      mov  r8, r0
0x00067d0c:  e1a06001      mov  r6, r1
0x00067d10:  e1a05002      mov  r5, r2
0x00067d14:  e28d0018      add  r0, sp, #24     ; 0x18
0x00067d18:  e3a01000      mov  r1, #0  ; 0x0
0x00067d1c:  e3a02098      mov  r2, #152        ; 0x98
0x00067d20:  eb001c50      bl   0x6ee68
We can see all the instructions, so we just have to convert the addresses into module+offset format, and we’ll end up with block coverage.
The only trick is that we need to know the load address that QEMU used in order to translate the raw virtual addresses into offsets from the base address of our target.
You can get the expected load address with readelf -l and looking at the first LOAD virtual address (0x10000 below), and then check that the start of the QEMU output matches the addresses and disassembly for _start by using Ghidra, Binary Ninja, or even objdump.
$ readelf -l arm-static-readelf

Elf file type is EXEC (Executable file)
Entry point 0x10bb8
There are 4 program headers, starting at offset 52

Program Headers:
  Type           Offset   VirtAddr   PhysAddr   FileSiz MemSiz  Flg Align
  EXIDX          0x0a4958 0x000b4958 0x000b4958 0x00008 0x00008 R   0x4
  LOAD           0x000000 0x00010000 0x00010000 0xa4964 0xa4964 R E 0x10000
  LOAD           0x0a5000 0x000c5000 0x000c5000 0x019c4 0x04b1c RW  0x10000
  GNU_STACK      0x000000 0x00000000 0x00000000 0x00000 0x00000 RW  0x10
A naive script to parse all unique addresses into module+offset format would look something like the following (more complete script here):
addrs_seen = set()
with open(in_file) as f:
    for line in f:
        if line.startswith('0x'):
            cur_addr = int(line.split(':')[0], 16)
            addrs_seen.add(cur_addr)

with open(out_file, 'w') as f:
    offsets_seen = [addr - module_base for addr in addrs_seen]
    for offset in offsets_seen:
        f.write(f'{module}+{offset:x}\n')
Using an emulator can help you out with weird binaries, but let’s jump into a technique that’s optimized for our use case.
How to get code coverage with DynamoRIO and drcov#
Most people get coverage information from instrumentation code inserted by their compiler, but by using dynamic binary instrumentation (DBI), we can do this by instrumenting the target on-the-fly as it runs.
Examples of well-known DBI frameworks include DynamoRIO, Intel Pin, Valgrind, Frida, and QBDI.
I like DynamoRIO because it’s a good mix of fast, flexible, and cross-platform/cross-arch, but any reasonable DBI platform will have an example of how to extract coverage information from it, and for DynamoRIO that’s drcov.
To collect coverage with drcov, use thedrrun utility from the command line using either drrun32 or drrun64 as appropriate for your target and specify the drcov tool, followed by your target’s invocation (the example is Linux, but it’s the same idea for Windows).
~/tools/DynamoRIO-Linux-9.0.1/bin64/drrun -t drcov -- echo test
If everything went well, you should see a block coverage information file in the same directory named something like drcov.echo.49133.0000.proc.log.
If you open that file, you’ll see that the drcov format includes a module table in text form followed by binary records for block coverage (you can provide the -dump_text flag after drcov but before the -- to see a more human-readable version of the binary format).
If you’re fuzzing or otherwise want to collect coverage for different input files, you can script running your target under drcov with different inputs. If you’re making coverage files manually, I can say from experience it’s probably smart to name each based on what behavior each one includes.

How to get code coverage using static rewriting#
The closest thing to compiler-inserted instrumentation without having the source and compiler is static rewriting (also called static instrumentation).
This method uses a framework to reverse-engineer the binary and patch in instrumentation code in specified locations; for example finding every basic block and inserting code to mark that the block has been executed. This is a tricky proposition, so there are limitations, but there are some pretty crafty techniques that make this viable for even something as intrusive as instrumenting every basic block.
We’re going to use the classic DynInst framework as our example, but two other interesting newer tools are bcov (which implements some smart graph ideas to estimate block coverage without instrumenting every block) and e9patch/e9afl.
I prefer using Docker to reduce dependency issues and avoid installing random pinned versions of stuff on my host, so let’s use the Dockerfile and instructions included in the DynInst repo to get a container we can build the example tools in:
git clone https://github.com/dyninst/dyninst.git
cd dyninst/

docker build -f docker/Dockerfile.ubuntu \
    -t dyninst-base:ubuntu-20.04 \
    --build-arg version=20.04 --build-arg build_elfutils=yes .
docker build -f docker/Dockerfile \
    -t dyninst:ubuntu-20.04 --build-arg build_jobs=16 \
    --build-arg base=dyninst-base:ubuntu-20.04 .

git clone https://github.com/dyninst/examples.git
cd examples/
docker run --rm -it -v $PWD:/examples dyninst:ubuntu-20.04 bash
Inside the container we’ll build the block coverage tool included in the example and test it out:
cmake . -DDyninst_DIR=/dyninst/install/lib/cmake/Dyninst/
make codeCoverage
cd codeCoverage/

export DYNINSTAPI_RT_LIB=/dyninst/install/lib/libdyninstAPI_RT.so
export LD_LIBRARY_PATH=.:/dyninst/install/lib:$LD_LIBRARY_PATH

./code_coverage -b testcc testcc.inst
./testcc.inst
This prints block coverage to stdout, which isn’t ideal, but we can write a script to parse out the blocks like we’ve done before, noting that the instrumented target outputs basic block addresses for the uninstrumented binary. Side note: if you do end up writing/finding a more robust block coverage tool for DynInst, please shoot me a note :)
root@85ab0d234fe9:/examples/codeCoverage# ./testcc.inst

 ************************** Code Coverage *************************

    1 : __do_global_dtors_aux, testcc
    1 : _fini, testcc
    1 : _init, testcc
    1 : frame_dummy, testcc
    1 : main, testcc.C

 ************** Code Coverage 5 out of 12 functions **************

 ************************** Basic Block Coverage *************************

 (__do_global_dtors_aux, testcc)
 	    1 : 0x401150
 	    1 : 0x40115d
 	    1 : 0x401166
 (__libc_csu_init, testcc)
 	    1 : 0x401246
 	    1 : 0x40123d
 	    1 : 0x401230
 	    1 : 0x401227
 	    1 : 0x401221
 (_fini, testcc)
 	    1 : 0x401268
 (_init, testcc)
 	    1 : 0x401000
 	    1 : 0x401016
 (frame_dummy, testcc)
 	    1 : 0x401180
 (main, testcc.C)
 	    1 : 0x401050
 	    1 : 0x40108b

 ************** Basic Block Coverage 14 out of 34 blocks **************
Note that DynInst has limitations and doesn’t work on all binaries; it’s up to you decide how much time you want to spend trying to figure out what could be going wrong… and now you’ve got a few techniques in your arsenal to fall back on.
That covers everything for today…#
It’s like the old song goes: “Getting the blocks is the haaaardest part”… or something like that. If you tested out one of these techniques and got some real coverage data, you should be proud!
A lot of folks never touch coverage, and they don’t know what they’re missing.
Next time we’ll be talking about visualizing the coverage data and interesting analysis you can do with that data.
Until then, is there a way of getting coverage that you like and I didn’t cover? Or maybe there’s a particular use case where you’d really like to get coverage but can’t? Hit me up on Twitter and let me know!