
I’m not sure why, but one of the most slept-on techniques I know of is “reversible debugging”, or time-travel debugging (TTD).
The idea has been around for quite a while, but it seems the best free way to experiment with it is using the venerable windbg.
I don’t have as much use for Windows-only tooling these days, but when Binary Ninja announced some improvements to their TTD integration, I thought it was about time to give it a spin!
This integration is somewhat new, so it seemed like it’d be worth going over the basic setup process and getting started with Binary Ninja TTD… and then we’ll talk about some of my favorite tricks to supercharge its effectiveness!
Setting Up Binary Ninja for TTD#
Consulting the docs on the topic is always a good idea, especially as my experience is just a snapshot in time, using version the latest stable at the time of writing (4.1.5902).
If you already have things set up, please feel free to skip to the part of this post where we start using it.
The overall setup process looks like this:
- Install windbg through Binary Ninja
- Record our trace in Windbg proper (not through Binary Ninja)
- Open the target binary in Binary Ninja
- Open our trace in Binary Ninja using the
Debuggerdropdown menu:- Target the trace with “Debug Adapter Settings”
- Start analyzing the trace with “Launch”
- Navigate our TTD trace by sending debugger commands via the
Console > Debuggertab
Installing Windbg#
You may already have windbg installed through the MS store, but in order for Binary Ninja to use it, we need to click the Install Windbg/TTD option in the Debugging menu.

If you don’t see that in the dropdown… are you on Windows? You kinda need to be on Windows for all of this.
Otherwise, watch the Python console and Log windows for errors during the install process, it worked without issue for me.
Recording a TTD Trace#
If you’re just running a normal program and recording the full trace, you can use Binary Ninja’s Debugger > Record TTD Trace option and fill out the dialog like the below:

It might not be obvious at first, but the trace files will be saved in the “Working Directory”.
For this post, I’m using the Windows’s ping.exe as my target, because I was curious how it worked under the hood.
It also shows how to specify command line arguments nicely, because we need to specify a target host or domain to ping.
If you need other workflows, like attaching to a running process, then you need windbg, but luckily it’s pretty easy to use and there are good docs on how to record a trace.
You can install windbg via the Microsoft store, or use find the DbgX.Shell executable that Binary Ninja installed, likely somewhere like C:\Users\user\AppData\Roaming\Binary Ninja\windbg\DbgX.Shell.
Just go to: File > Start Debugging > Launch executable (advanced).

Just note where the trace is going to be saved, and run the target as normal while recording (in my case, ping exits on its own).
Opening the Target and Trace#
Yup, we need to open the target binary in Binary Ninja (still on Windows, mind you).
Then go to Debugger > Debug Adapter Settings and select DBGENG_TTD from the dropdown, and then select a new file for the Executable Path, choosing the .run file from the TTD trace you just made (it’s the one with the windbg icon).

The settings should look something like this:

Then go to the Debugger menu, pick Launch, and we should see the debugger stop at the entry point of our target.

Now we’re ready to take this shiny new feature for a ride!
Using TTD in Binary Ninja#
The basic idea is that we can run many of the same commands that we could in windbg via Binary Ninja’s Debugger tab in the Console pane.
For TTD, this means that in addition to g, p, t (for Go, steP over, Trace into), we can now do the reverse with g-, p-, and t-.
Or we can use the fancy new buttons!

If you aren’t familiar with windbg, when certain commands run it might seem like the debugger hangs, but it’s actually working in the background.
Windbg has a helpful *BUSY* indicator, but unfortunately Binary Ninja also inherits some of this behavior, so just be patient if certain commands take a while.

Not everything is completely the same, for example in Windbg we get tab completion on known symbols, and certain commands won’t work in the debugger console (like .hh for looking up help on different commands).
But this way we get a fully capable reversing environment with Python scripting, various ILs, and sweet graph views.
It’ll be really interesting to see what will come out of the nexus of Binary Ninja and TTD in the future… it all seems very promising!
Binary Ninja TTD’s Killer App: Coverage Highlighting#
Using a tool like bncov or lighthouse, we can use coverage to highlight basic blocks, which together with TTD will dramatically speed up our ability to understand traces.
If you have any problems with bncov, please open an issue and I’ll do my best to help you out!
This a two-step process:
- Extract coverage from the TTD trace
- Overlay coverage with bncov as covered in my previous post
Extracting coverage via windbg script#
First download 0vercl0k’s codecov.js script: https://github.com/0vercl0k/windbg-scripts/blob/master/codecov/codecov.js
Just click the “Download raw file” button and save it where you like.
NOTE: running the script in Binary Ninja’s Debugger pane should work, but it didn’t for me… so I’m showing how to run it in windbg here, but YMMV.
Next, open up the TTD trace in windbg (should be in your File > Recent list, or do “Open a Trace”), and run the script like below, inserting your own script path and target module name:
.scriptload "C:\Users\user\Downloads\codecov.js"
!codecov "PING"
If you haven’t set up windbg before, you might be looking at a big empty window, but that’s all you need to type into the command box.

Make sure there aren’t any errors in the windbg output window. On success the script should drop a file with coverage in the same directory as the trace.
Importing Coverage in Binary Ninja#
To install bncov via the plugin manager, press CTRL+SHIFT+M on Windows and then type bncov in the search window.
Right-click on the bncov entry and pick “Install”, accept the msgpack dependency, then wait for it to install (watch the Log window).
If bncov is installed correctly, we should be able to open the Plugins dropdown at the top of the window and see an entry for bncov.
If you don’t see it, go back to the bncov entry in the plugin manager, and make sure it’s enabled (right-click the entry and click enable), restarting Binary Ninja as needed.

Once bncov is installed, set your view to disassembly of the entry point or main function, then right-click and do “Plugins > bncov > Coverage Data > Import File” and find the coverage file that the codecov.js script generated.

Boom, now we can see everything that got executed… which really enhances our TTD experience.
If you don’t see anything highlighted, check that 1) you haven’t already started the debugger and rebased the target binary, 2) you’re in a function that actually got executed, and 3) that you’re not in “High-Level IL” view, which is the only view that doesn’t automatically highlight (we’ll get to that).
Capitalizing on Coverage#
Highlighting the blocks that actually ran is really helpful in and of itself, but there’s two other quick tricks I wanted to share.
One: leverage the Python console to help your exploration.
For example, the wmain function of ping.exe is massive, so if we want to see what non-library functions it calls, we can type up a quick snippet:
for f in set(current_function.callees):
    print(f.name, hex(f.start))
Then we can just click on the addresses to bounce between them, and we can see what got called by which ones start with a red block!

Second trick: if you want high-level IL highlighting, drop the snippet below into the Python console. It’s not perfect, but it’s still really helpful:
# If you installed bncov from plugin manager:
import ForAllSecure_bncov as bncov
# If you installed from GitHub, instead do:
# import bncov
# Snippet to map coverage from disasm to HLIL
def transfer_highlights_to_instructions(covdb: bncov.CoverageDB):
    bv = covdb.bv
    for block_address in covdb.total_coverage:
        for block in bv.get_basic_blocks_starting_at(block_address):
            cur_highlight = block.highlight
            block.set_user_highlight(HighlightStandardColor.NoHighlightColor)
            cur_function = block.function
            cur_addr = block.start
            for cur_token, cur_inst_size in block:
                cur_function.set_user_instr_highlight(cur_addr, cur_highlight)
                cur_addr += cur_inst_size

# Get the coverage db for file currently open
covdb = bncov.get_covdb(bv)
# Apply highlights
transfer_highlights_to_instructions(covdb)
I was able to toss that entire blob into the Python console and get HLIL highlighting in both linear and graph view (just make sure to do this before launching the debugger).

Highlighted decompilation plus a debugger that can go forward and back? That makes reversing a TON easier.
Example: Deconstructing Ping#
So how can we test out our new reversing superpowers?
Well I’m still curious how ping.exe works.
My initial guesses were either A) there’s some esoteric Windows API function that does all the work, or B) they have some fancy internal logic (which I considered less likely).
So let’s start with the wmain function, though if you’ve never seen a wmainCRTStartup-style entrypoint for a Windows executable, it’s much easier to navigate with public symbols and block highlighting ;)

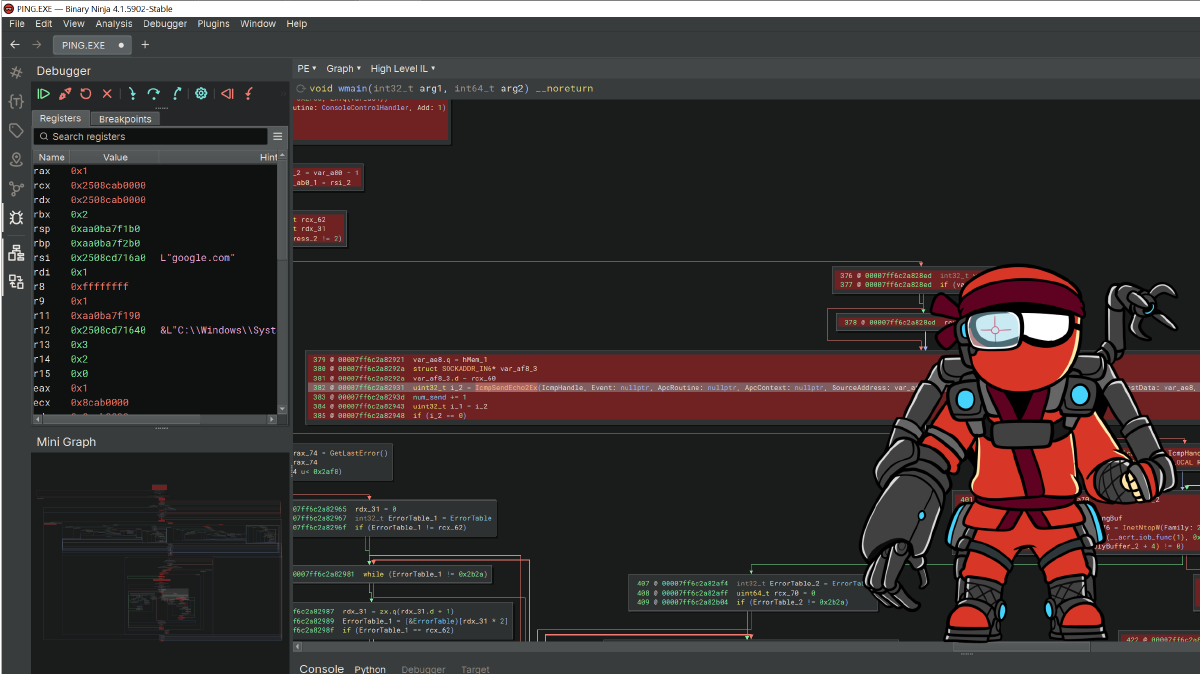
wmain is a really long function (like almost 1,000 lines of linear HLIL), and for a long function with that much indentation, I find looking at the graph view easier…
Especially because we can ignore the majority of the blocks since they’re uncovered.
Trawling through the graph looking at covered blocks, we eventually come across two functions that sound interesting: IcmpCreateFile and IcmpSendEcho2Ex.

Just as we expected, oddball API functions do all the work.
Good ol’ IcmpSendEcho2Ex, am I right?
Let’s Go Faster#
I know. I hear you.
Reading is hard, and we should do as little of it as possible.
Here’s faster ways to reach the same conclusion:
First: use the Binary Ninja’s Triage view, especially for Windows binaries.
The Imports box doesn’t have too many entries for ping.exe, and the ICMP functions are right at the top.
Plus, we can use the cross-references to jump to where they’re called.

Second: once we have coverage imported, use bncov’s Coverage Report via Plugins > bncov > Reports > Show Coverage Report. There’s only like 20 functions with coverage, and most of them don’t sound network- or ICMP-related.
So after doing very little work, the “lots of custom logic” theory appears quite unlikely.

Third: use bncov to elevate your script-fu.
There are 135 locations where wmain calls other functions.
But if we narrow down the list to just what’s in basic blocks that are covered, it drops to a manageable 39, and we can spot our interesting API calls pretty quickly:
covdb = bncov.get_covdb(bv)
for site in current_function.call_sites:
    blocks = bv.get_basic_blocks_at(site.address)
    if any(bb.start in covdb.total_coverage for bb in blocks):
        print(hex(site.address), site.hlil)
# Yields results like:
# 0x140001be6 SetThreadUILanguage(0)
# 0x140001bfc HeapSetInformation(nullptr, HeapEnableTerminationOnCorruption, nullptr, 0)
# 0x140001def GetDefaultTTL()
# 0x140001eb8 GetIpForwardTable(nullptr, &var_a70, 0)
# 0x140001f9e rax_26, address_1 = ResolveTarget(r14, Terminator_2, &address, 0xfffd, &var_858, var_af0)
# 0x14000265a IcmpHandle_1 = IcmpCreateFile()
# 0x140002931 uint32_t i_2 = IcmpSendEcho2Ex(IcmpHandle, nullptr, nullptr, nullptr, var_af8_2.d, data_1400076e4, var_ae8, var_a84.w, &RequestOptions, ReplyBuffer, rbx_5.d, Timeout)
For more tricks like this, check out the
this post on doing more with coverage data from bncov.
Going Forward (and Back)#
Personally I feel like this is a huge step for reversing because it helps us quickly focus on the code that got executed and debug to our heart’s content. We can see exactly where a function got called statically in HLIL, and we can time-travel to the beginning and end of every function call to help understand inputs and outputs.
For now, the Binary Ninja TTD experience is still maturing… whereas windbg is ancient and powerful. So I think of this as another tool in the arsenal rather than a complete replacement.
But if I have a Windows target that I don’t have source for and want to understand it quickly, TTD plus coverage highlighting is a pretty slick setup.
I hope this helped you, and if it did, follow my Twitter/Mastodon to keep up with cool stuff like this!